
How Deep Is the Bitcoin Dip? What On-Chain Data Says
CQ Insights
Bitcoin closed at $61,915 on November 19, 2026, down 28.5% from its September high and 50.4% below its all-time high. It's the lowest close since July 2, and it leaves price 5.8% above June's $58,535 low. This is no longer a routine pullback. It's a test of whether June was the cycle bottom, and supply in loss is already higher than it was at that low.
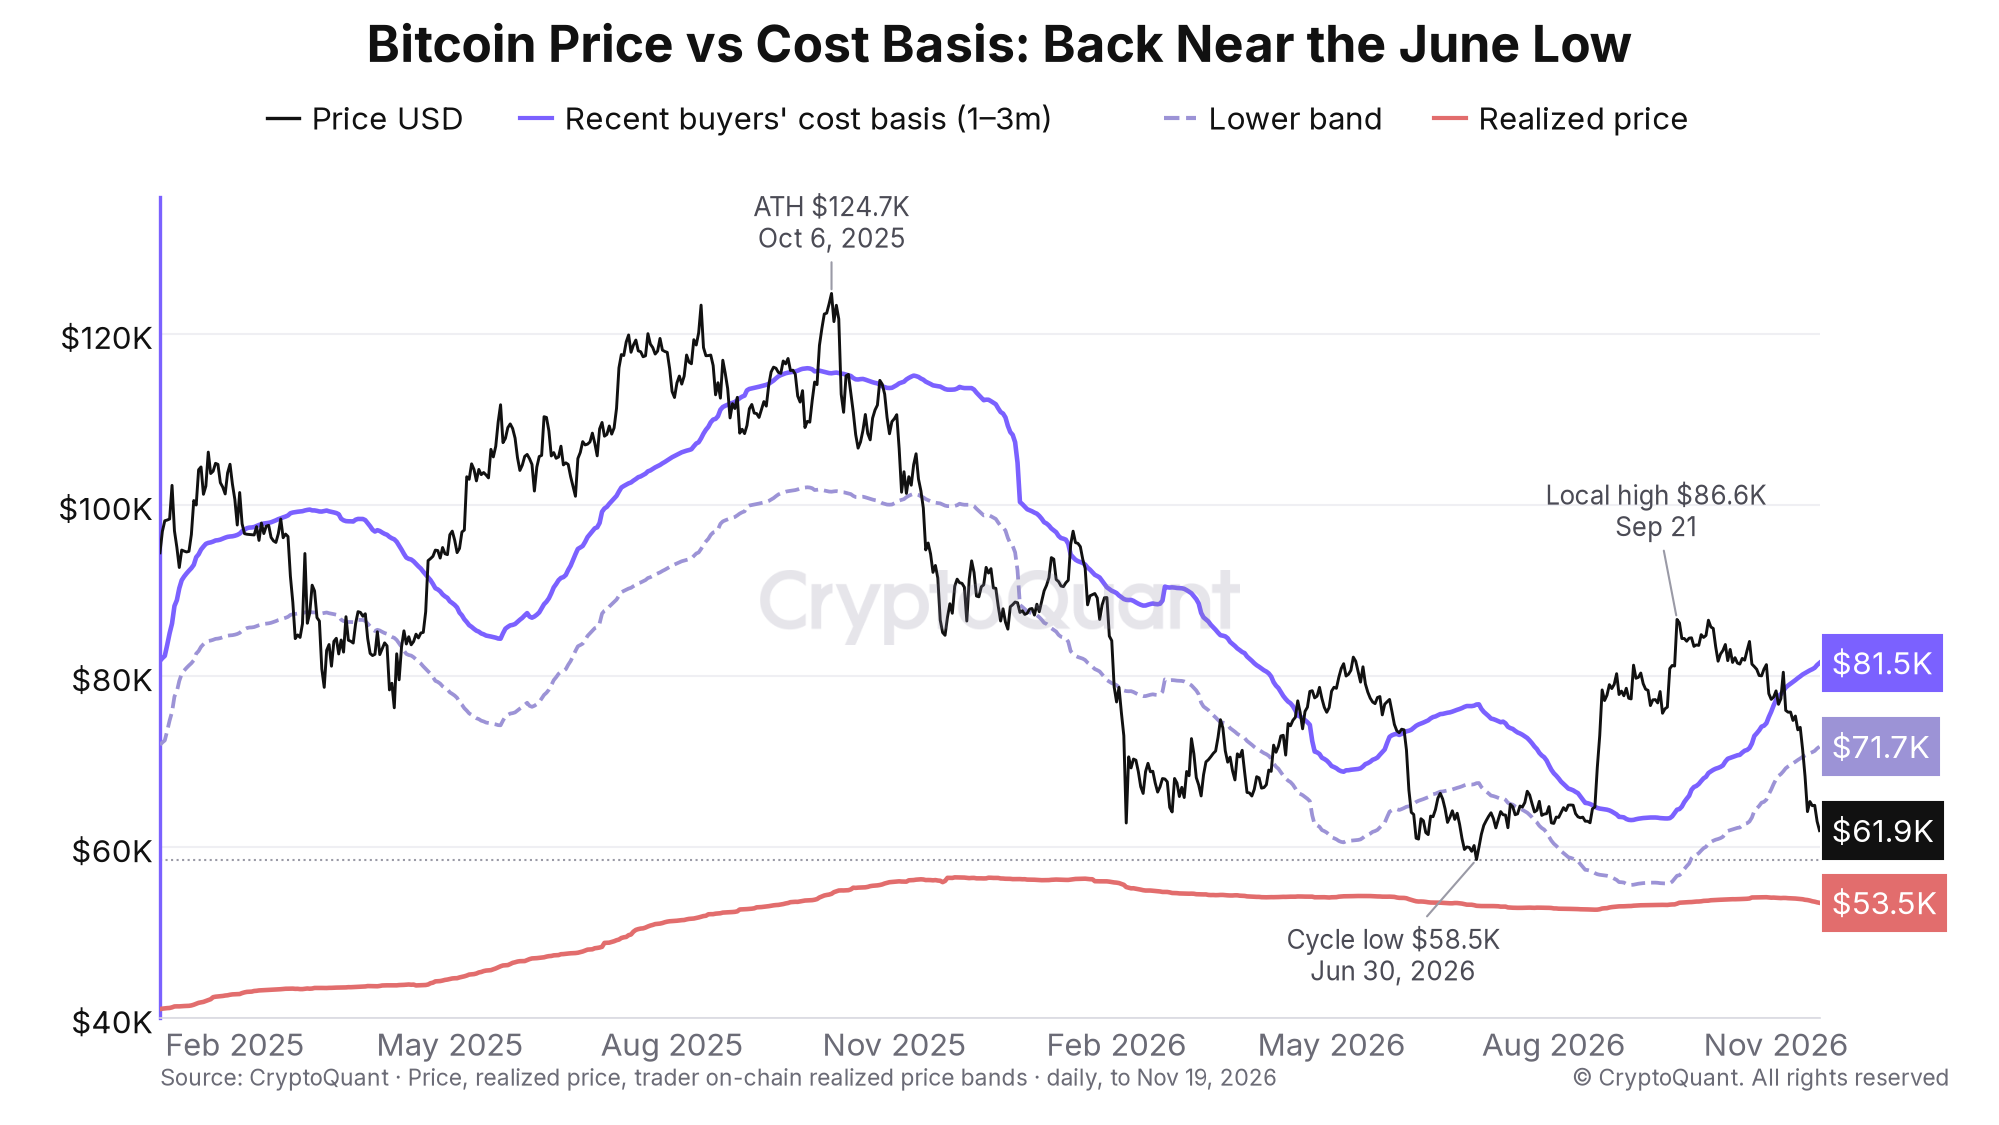
Bitcoin against three cost bases, January 2025 to November 19, 2026. Price ($61.9K) sits 24.0% below recent buyers' cost basis ($81.5K) and 15.8% above the market's realized price ($53.5K).
How deep is the Bitcoin dip?
Measure (November 19, 2026) | Value |
|---|---|
BTC close | $61,915 |
From the September 21 closing high ($86,601) | −28.5% |
From the all-time high (October 6, 2025, $124,710) | −50.4% |
From the cycle low (June 30, 2026, $58,535) | +5.8% |
Realized price, the market's average cost basis | $53,478 (price 15.8% above) |
1.16 (1.62 at the September high, 1.10 at the June low) | |
54.7% (22.1% at the September high, 53.8% at the June low) | |
Cost basis of 1–3 month holders | $81,521 (price 24.0% below) |
The slide started with profit-taking after the September rally. As CryptoQuant's research team set out in Razor's Edge: Local Bottom or Deeper Correction?, it then picked up pace on a more hawkish Fed, the October 29 Binance hack and the US mid-term results. A second leg followed: BTC fell from $71,388 on November 12 to $64,139 on November 14, a 10.2% drop in two days. The team's November 17 report, Bear Claw, says Bitcoin is back in a bearish phase, with price in a value zone.
How this dip compares with past recoveries
A 28.5% drop is deep for a recovery. Between each cycle low and the reclaim of the previous all-time high (2015–17, 2019–20 and 2023–24), Bitcoin had 13 pullbacks of 14% or more. The median one bottomed at −22.9% from its high, about $66,800 measured from September's peak. BTC closed below that on November 14, and the current dip is now deeper than nine of the 13.
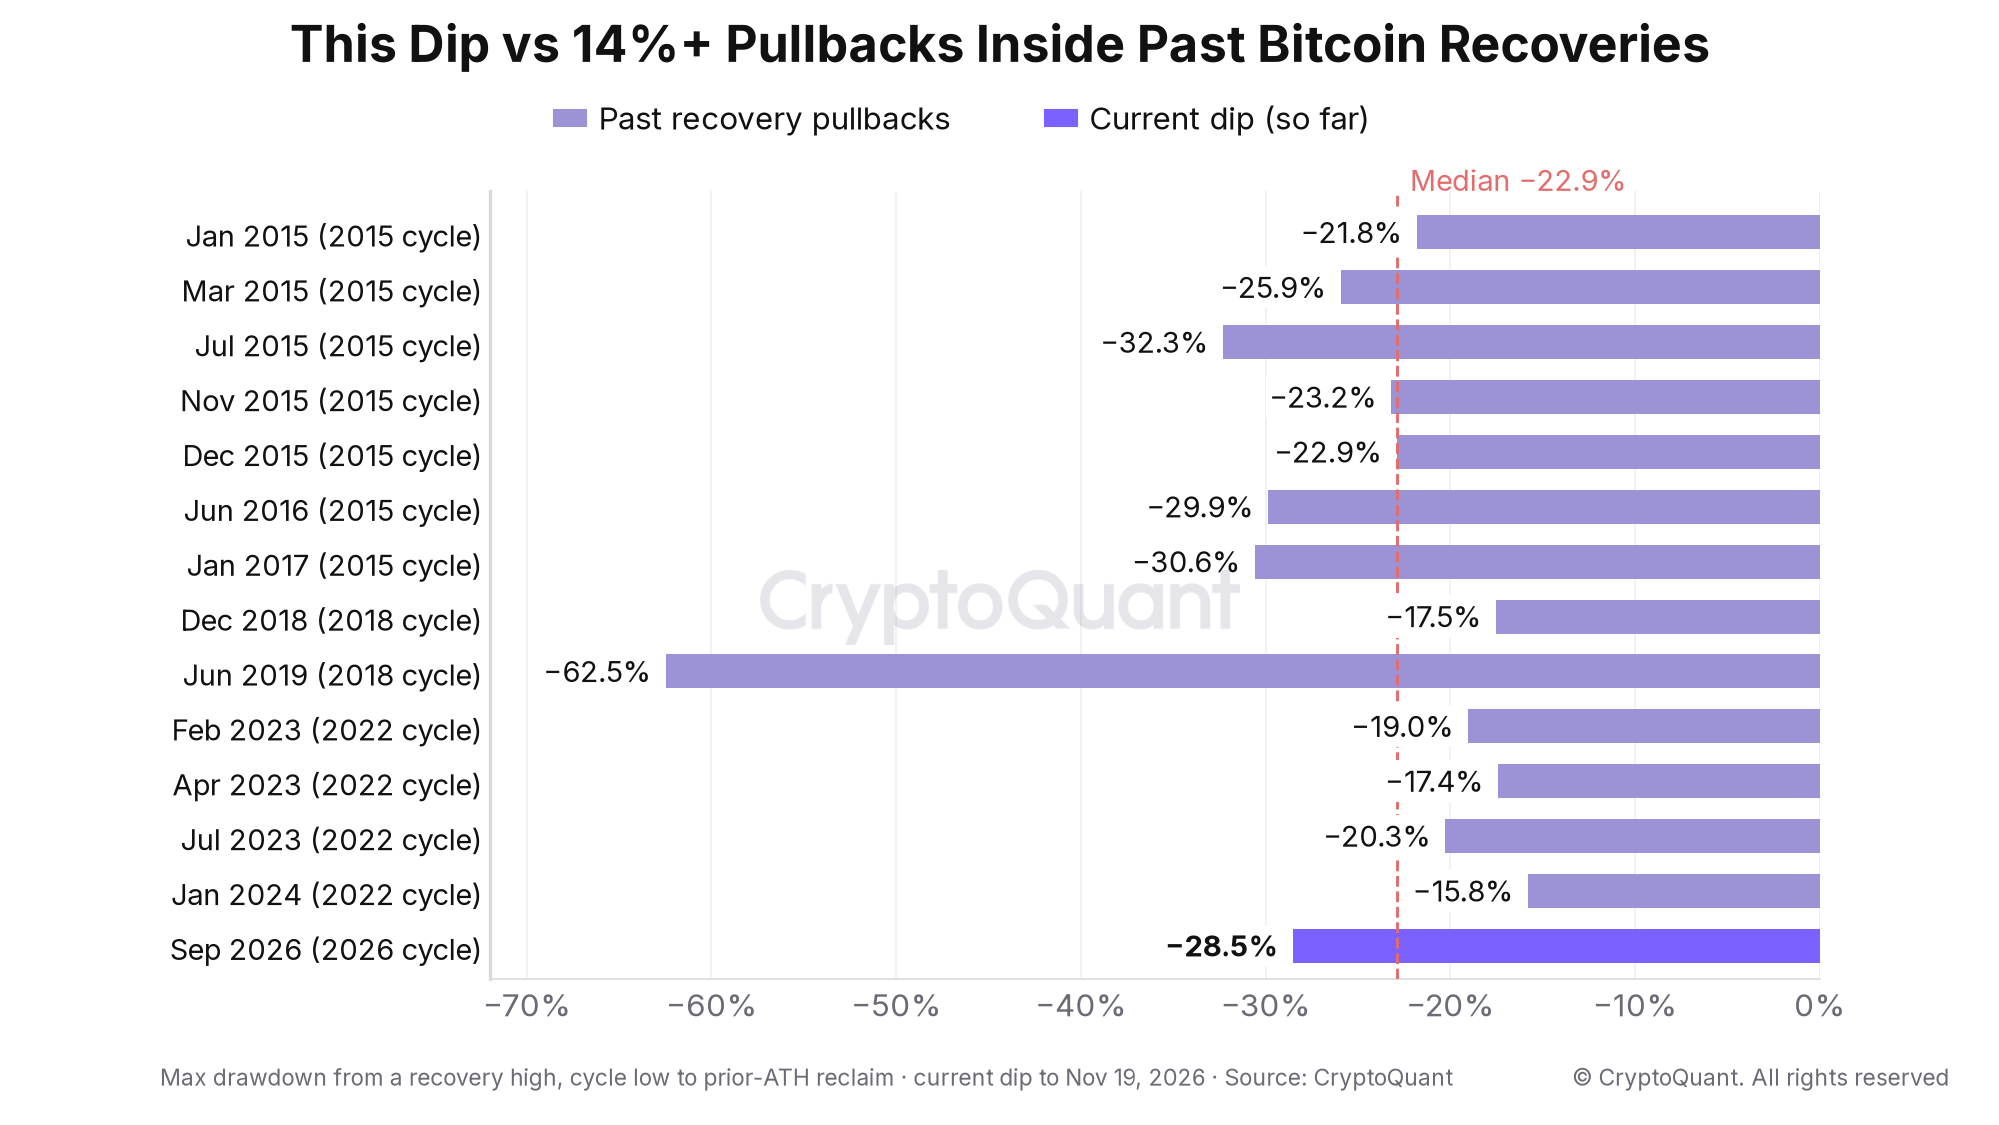
Maximum drawdown of every 14%+ pullback inside past Bitcoin recoveries. The current dip (−28.5% so far) is deeper than nine of the 13.
Only four went deeper: −29.9% in 2016, −30.6% in early 2017, −32.3% in 2015 and −62.5% in 2019–20. From the day each pullback crossed −14%, BTC was higher 90 days later in 77% of cases, with a median gain of +18.8%. After 365 days, 12 of 13 were higher. This dip crossed −14% on November 10. None of the 13 fell below the cycle low that started the recovery, so a close below $58,535 would do what no pullback in a past recovery did.
The exception is the one to remember. The pullback from June 2019's $12,916 high kept going into the March 2020 COVID crash and bottomed 62.5% lower. A year later BTC was still 14.7% down. Thirteen cases from three cycles is a small sample, and it says more about what normal looks like than about what happens next.
Correction or bear market? Today's readings have only one precedent
Today's MVRV (1.16) and supply in loss (54.7%) have rarely shown up together. Since 2012, only 10 days with MVRV between 1.09 and 1.24 and supply in loss between 51% and 59% have a 180-day outcome. All 10 came from the 2014 bear market: nine in late September and one in December. Bitcoin was lower 180 days after every one of them, with a median return of −36.5%.
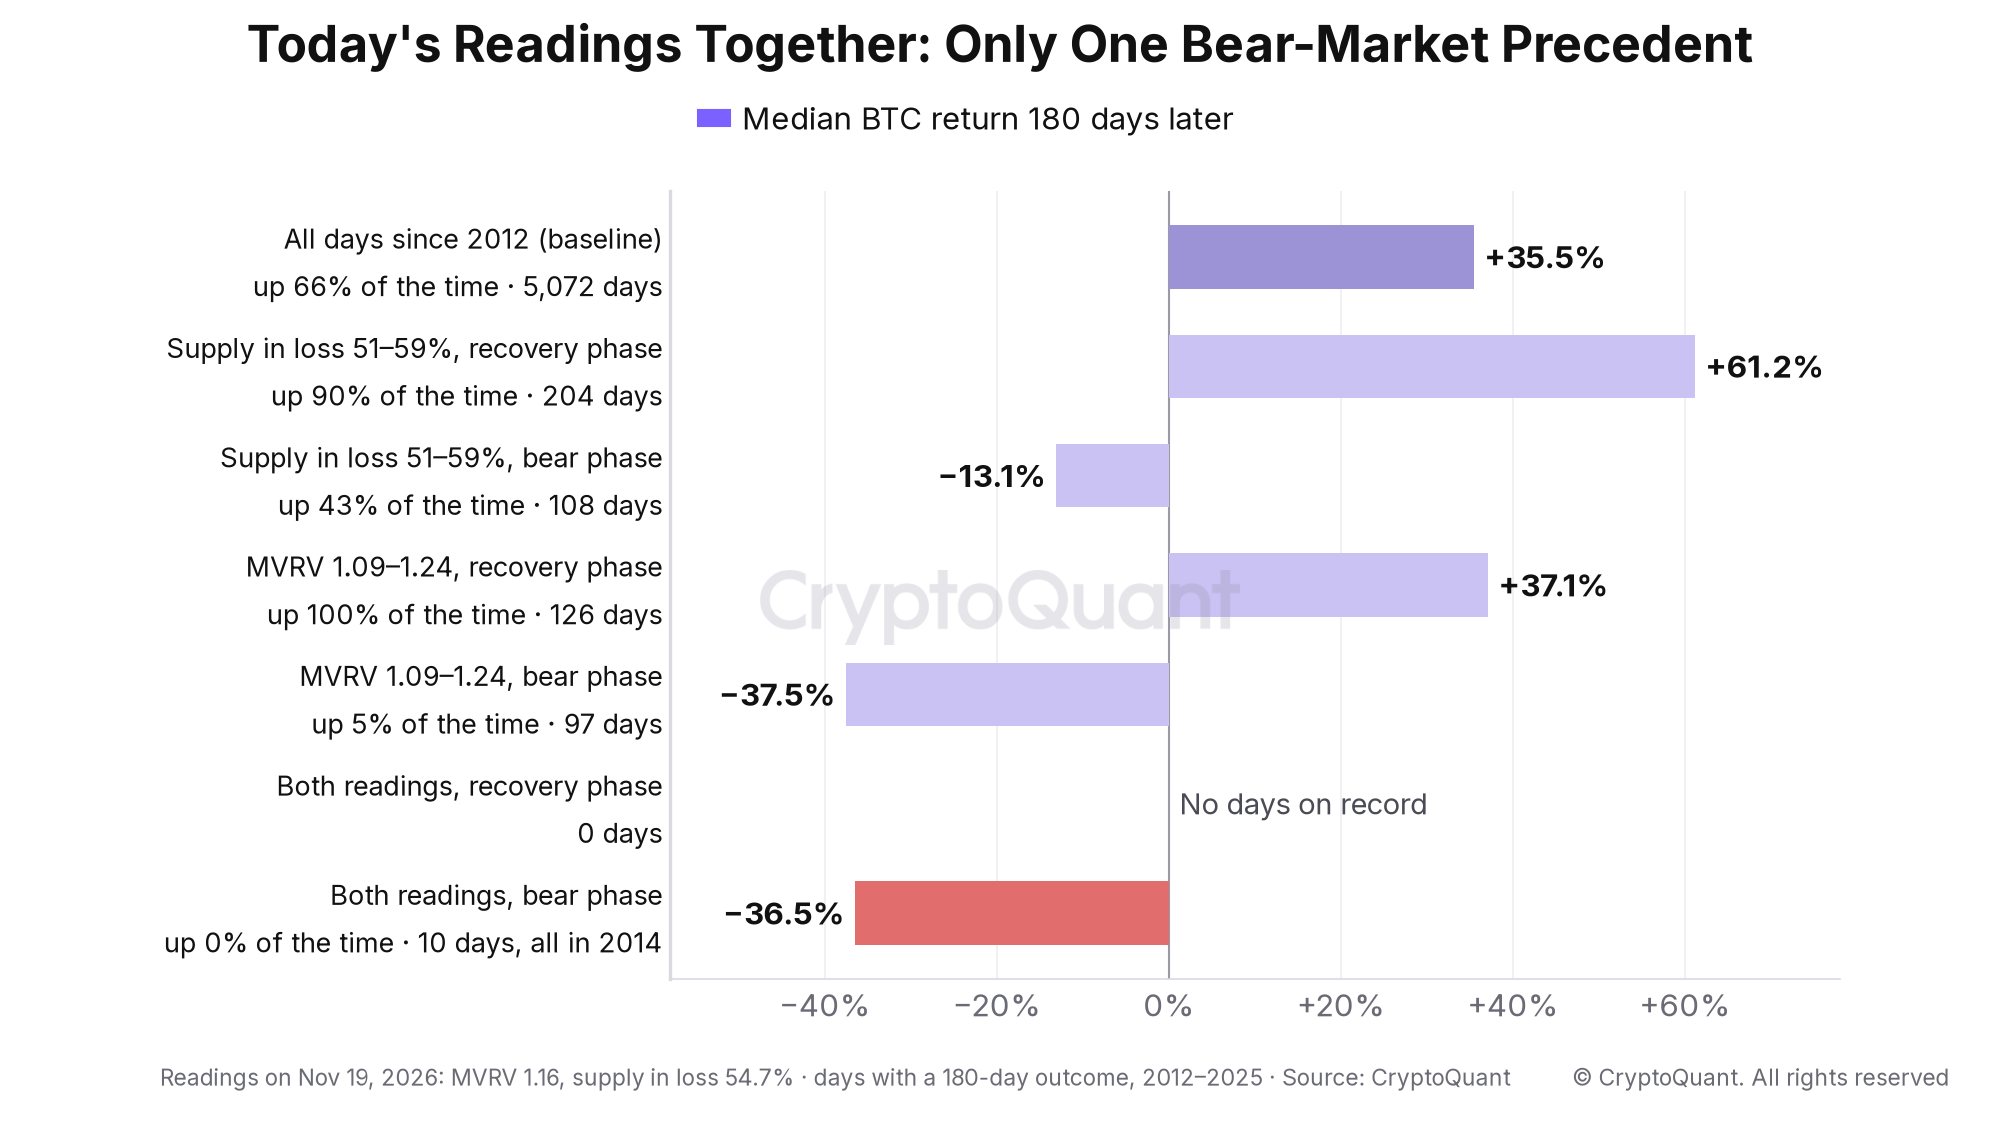
Median BTC return 180 days after readings like today's (MVRV of 1.09–1.24, supply in loss of 51–59%), alone and together, split by cycle phase. Days with a 180-day outcome, 2012 to 2025.
When the readings appeared | Days | Median return after 180 days | Share higher |
|---|---|---|---|
All days since 2012 (baseline) | 5,072 | +35.5% | 66% |
Both readings, any phase | 10 | −36.5% | 0% |
Both readings, recovery phase (after a cycle low) | 0 | n/a | n/a |
Both readings, bear phase (after a cycle top) | 10 (all in 2014) | −36.5% | 0% |
Each reading on its own still splits by phase. Supply in loss of 51–59% came before a median +61.2% over 180 days in recoveries (204 days, 90% higher) and −13.1% in bear phases (108 days). MVRV of 1.09–1.24 came before gains on all 126 recovery days (median +37.1%) and a median −37.5% on 97 bear-phase days. What's unusual is having both at once. In past recoveries, supply in loss above 50% only came with MVRV at or below 1.06. Today more than half of supply is in loss with price still 15.8% above the market's cost basis.
The caveats are bigger than the result. Ten days from one episode is one precedent, not a sample. In 2026 the same combination appeared on 12 days between June 5 and July 1 and on three days this month, none with a 180-day outcome yet. We also labelled the phases with hindsight, because a cycle low is only known to be the low afterwards. Read the table as a warning that history has no recovery-phase example of today's readings, not as a forecast.
What says recovery, and what says caution
For a recovery:
Price is still above the market's cost basis. At $61,915, BTC is 15.8% above realized price. Our Unbiased episode with David Puell flagged a revisit of realized price as the main downside risk. That level is $53,500 today.
Losses are back at capitulation levels. Supply in loss is 54.7%, above June's 53.8% peak and just under the 55–61% seen at the 2015, 2018 and 2022 cycle lows. The Bear Claw report puts price in a value zone and says trader losses this deep have come with bottoming formations, which tend to take at least two months.
Coins keep leaving exchanges. Exchange reserves across all exchanges fell 46,917 BTC in the 90 days to November 19. Our exchange reserve playbook explains why that's a backdrop rather than a timing signal.
For caution:
The June low was shallow by cycle standards. MVRV bottomed at 1.10 and is 1.16 now. The 2015, 2018 and 2022 cycle lows came at 0.56, 0.70 and 0.78.
Recent buyers are deep underwater. Price is 24.0% below the $81,521 cost basis of coins bought one to three months ago. It also lost the lower band of trader realized price, now $71,738, on November 13.
US demand hasn't shown up. The Coinbase premium has been negative every day since September 5. It fell to −0.27% on October 29 and was −0.12% on November 19.
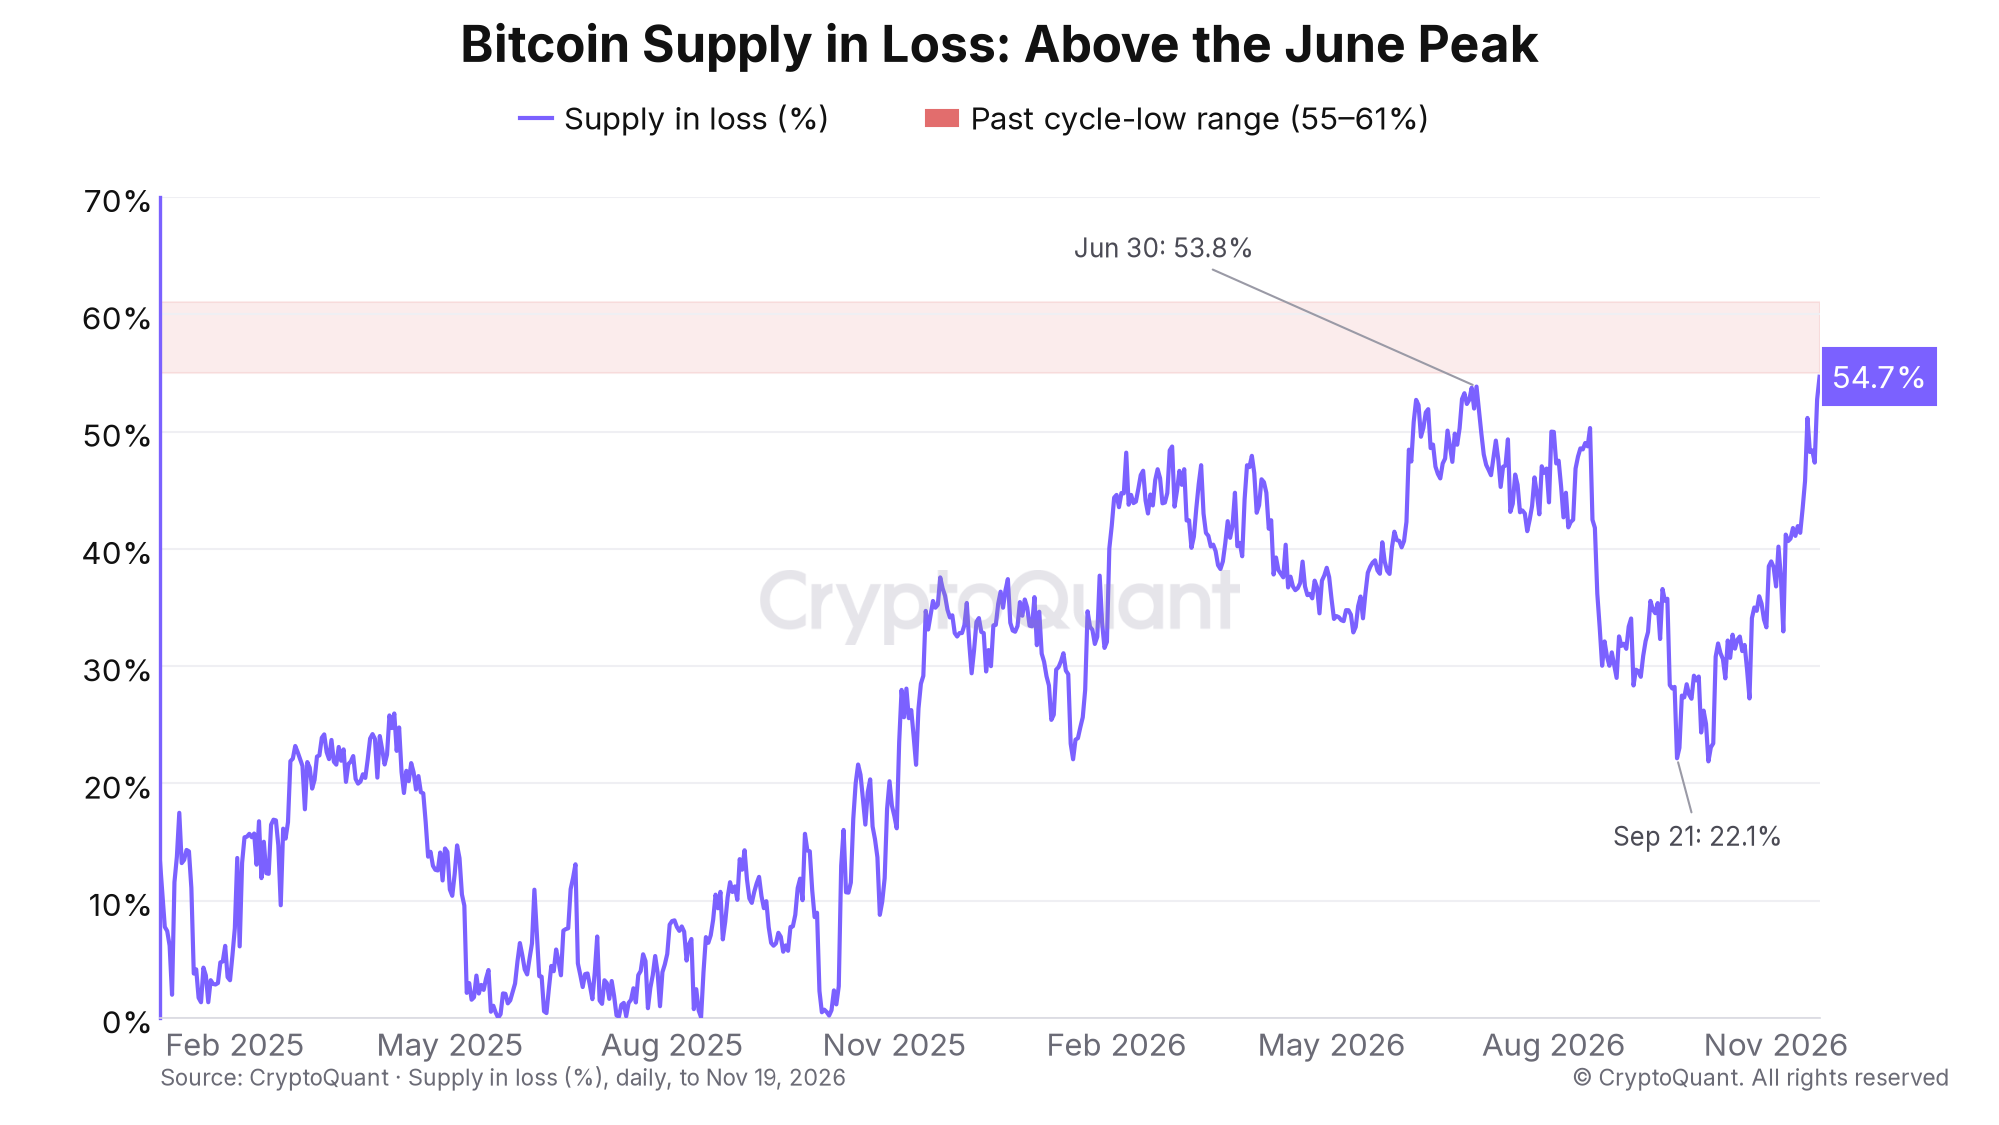
Bitcoin supply in loss, January 2025 to November 19, 2026. At 54.7%, it's above the 53.8% reached at the June low and just under the 55–61% range of past cycle lows.
Leverage has started to flush, but it isn't cleared
A healthy correction usually clears out leverage. This one has started to. Open interest fell 9.2% on November 13 and 6.9% on November 14, both large enough to count as a flush by our playbook's definition. About $829 million of long positions were liquidated over those two days, the two largest daily totals since February 5. In dollars, open interest is down 30.3% since September 21 and at its lowest since June 27.
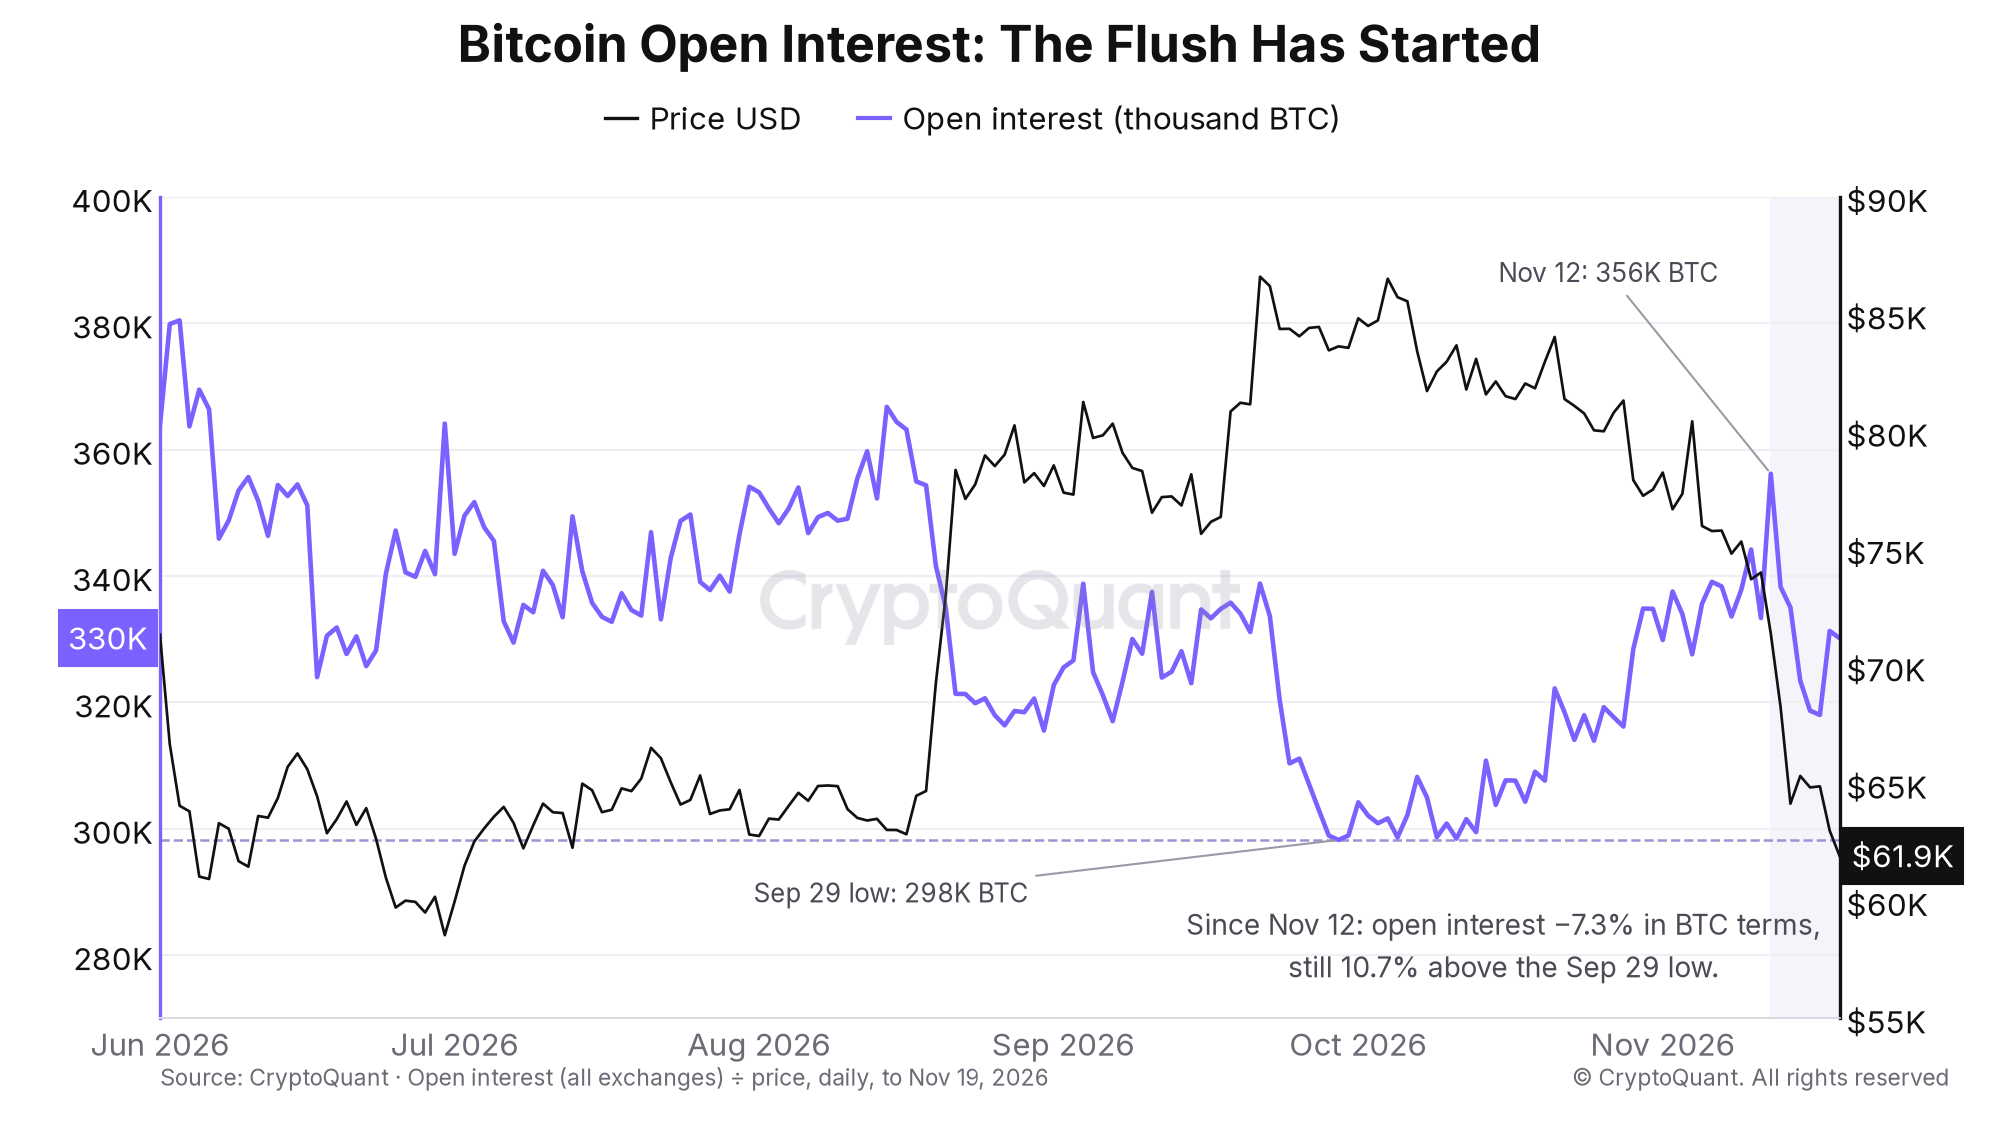
Bitcoin open interest in BTC terms against price, June to November 19, 2026. Open interest fell from 356,181 BTC on November 12 to 330,145 BTC, still above the September 29 low of 298,209 BTC.
It isn't cleared, though. Measured in BTC, open interest is down 7.3% from its November 12 peak of 356,181 BTC, but at 330,145 BTC it's still 10.7% above the September 29 low of 298,209 BTC. Funding rates have stayed positive every day since September 21. They peaked at 0.016% on November 6 and were 0.004% on November 19, so longs are still paying to hold positions. In the week before the flush, funding averaged 0.009%, just under the 0.01% line our funding rates and open interest playbook uses for crowded longs. The playbook's stronger returns came after flushes that cleared crowded longs, and this one started just short of that line.
The levels that decide it
Level | Price | What it would mean |
|---|---|---|
Recent buyers' cost basis (1–3 months) | $81,500 | Reclaiming it would put the 2026 recovery back on track |
Lower band of trader realized price | $71,700 | Lost on November 13. Reclaiming it is the first step back |
Supply in loss above 50% | 54.7% now | June conditions are back, and so is bear-phase risk |
June cycle low | $58,500 | No pullback in a past recovery broke its cycle low. Price is 5.8% above it |
Realized price | $53,500 | The market's average cost basis |
The research team's Bull Score Index stands at 10 after falling to 0 on November 10. Bear Claw reads that as extreme bear, with no conditions yet for a sustainable recovery, and puts resistance at the 200-day and 365-day moving averages ($72.9K and $75.9K). As CryptoVizArt argued on Unbiased, recoveries tend to move in a staircase: rallies, plateaus and tests of support. This is the test. Whether it holds will show up in the levels above before it shows up in the headlines.
Track it live
Every level in this post updates daily on CryptoQuant:
Cost basis and valuation: realized price, MVRV ratio, supply in loss and trader realized price bands.
In your own models and agents: pull the same series with the CryptoQuant API (our Python tutorial gets you started) or the CryptoQuant MCP.
The market dipped. So did we.
If you want to watch these levels yourself, CryptoQuant's Black Friday pricing takes 40% off Pro and 30% off Advanced yearly plans, through Cyber Monday, November 30. See the offer.
FAQ
Is Bitcoin in a bear market?
It leans that way, but it isn't confirmed. CryptoQuant's research team says Bitcoin is back in a bearish phase, recent buyers are deep underwater and US demand is weak. But price is still 15.8% above the realized price and above the June 30 low of $58,535. No pullback inside a past recovery closed below its cycle low, so that's the level to watch.
How far is Bitcoin from its all-time high?
On November 19, 2026, BTC closed at $61,915, 50.4% below its all-time closing high of $124,710 on October 6, 2025. It is 28.5% below its September 21, 2026 closing high of $86,601.
What does Bitcoin's realized price say right now?
Realized price, the average price at which every coin last moved, is $53,478. BTC trades 15.8% above it. In 2015, 2018 and 2022, price fell below realized price at the cycle low. In 2026 it hasn't: the June low was still 10% above it.
What does the MVRV ratio say about this dip?
MVRV is 1.16, down from 1.62 at the September high and close to the 1.10 reached at the June low. Readings in the 1.09–1.24 range were followed by gains inside past recoveries and by losses in 95% of bear-phase cases, so on its own it doesn't settle the question.
What is Bitcoin supply in loss?
It's the share of all bitcoin last moved at a higher price than today's. At 54.7%, it's the highest of 2026: above the 53.8% reached at the June low and just under the 55–61% seen at past cycle lows.