Cited by


Built for traders,
institutions and developers.
CryptoQuant is an on-chain data and crypto market analytics provider, founded in 2018, serving traders, institutional investors and developers through its app, REST API and MCP server.
- 01 / Traders
Digital asset data, market data and sentiment in one place.
- Spot and perpetual futures coverage: OHLCV, funding rates, open interest and liquidations, alongside exchange flows and reserves.
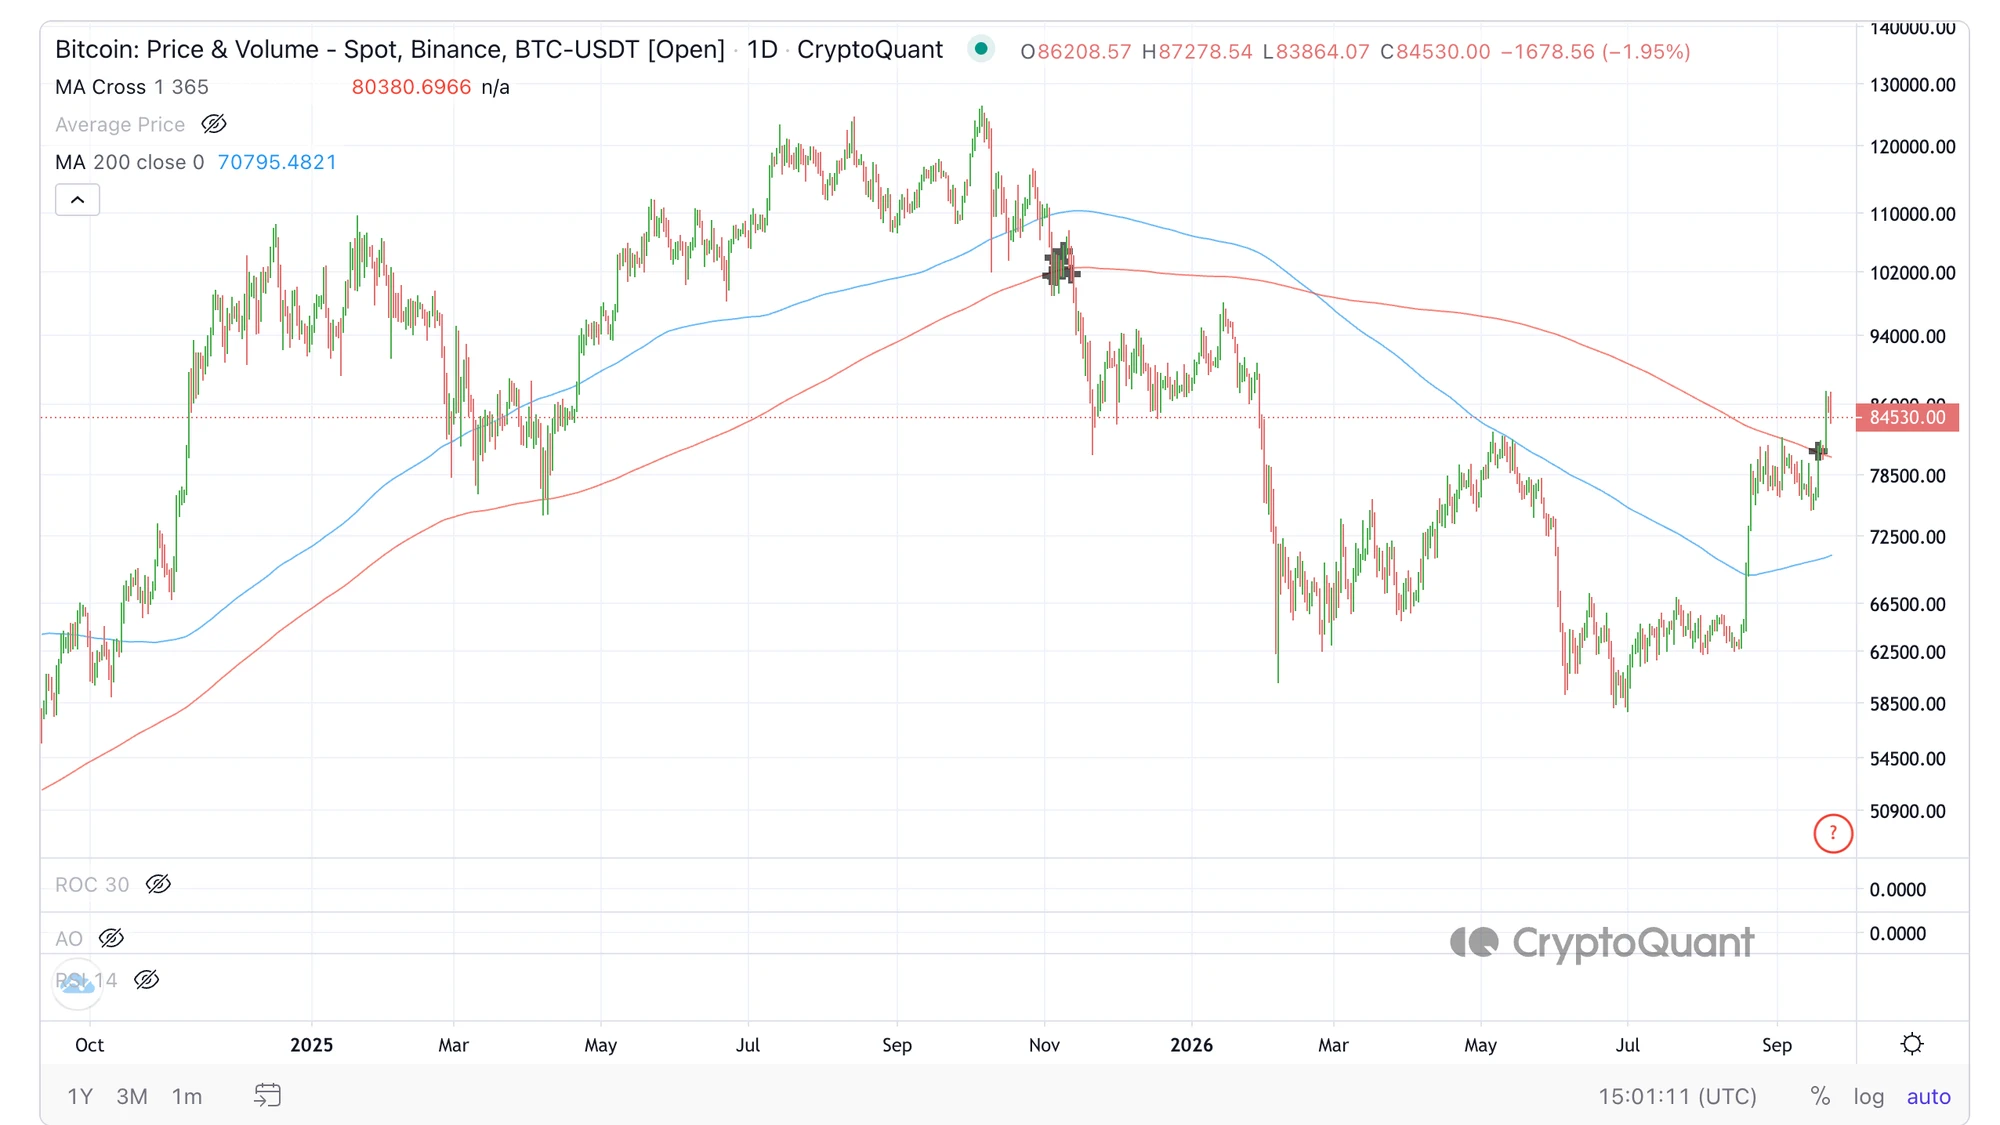
- Pre-built charts for whales, miners, short-term holders and long-term holders, plus proprietary indicators with historical thresholds.
- Receive real-time alerts by email and Telegram on fund movements, whale transactions and preset market signals.
- 02 / Institutions
Institutional market intelligence data, research and dedicated support.
- Enterprise plans, custom data delivery and redistribution licensing
- Applied research, weekly market reports and white-label reporting
- Data integration, listings and content services, with a dedicated account manager
- 03 / Developers
An on-chain data API and a remote MCP server.
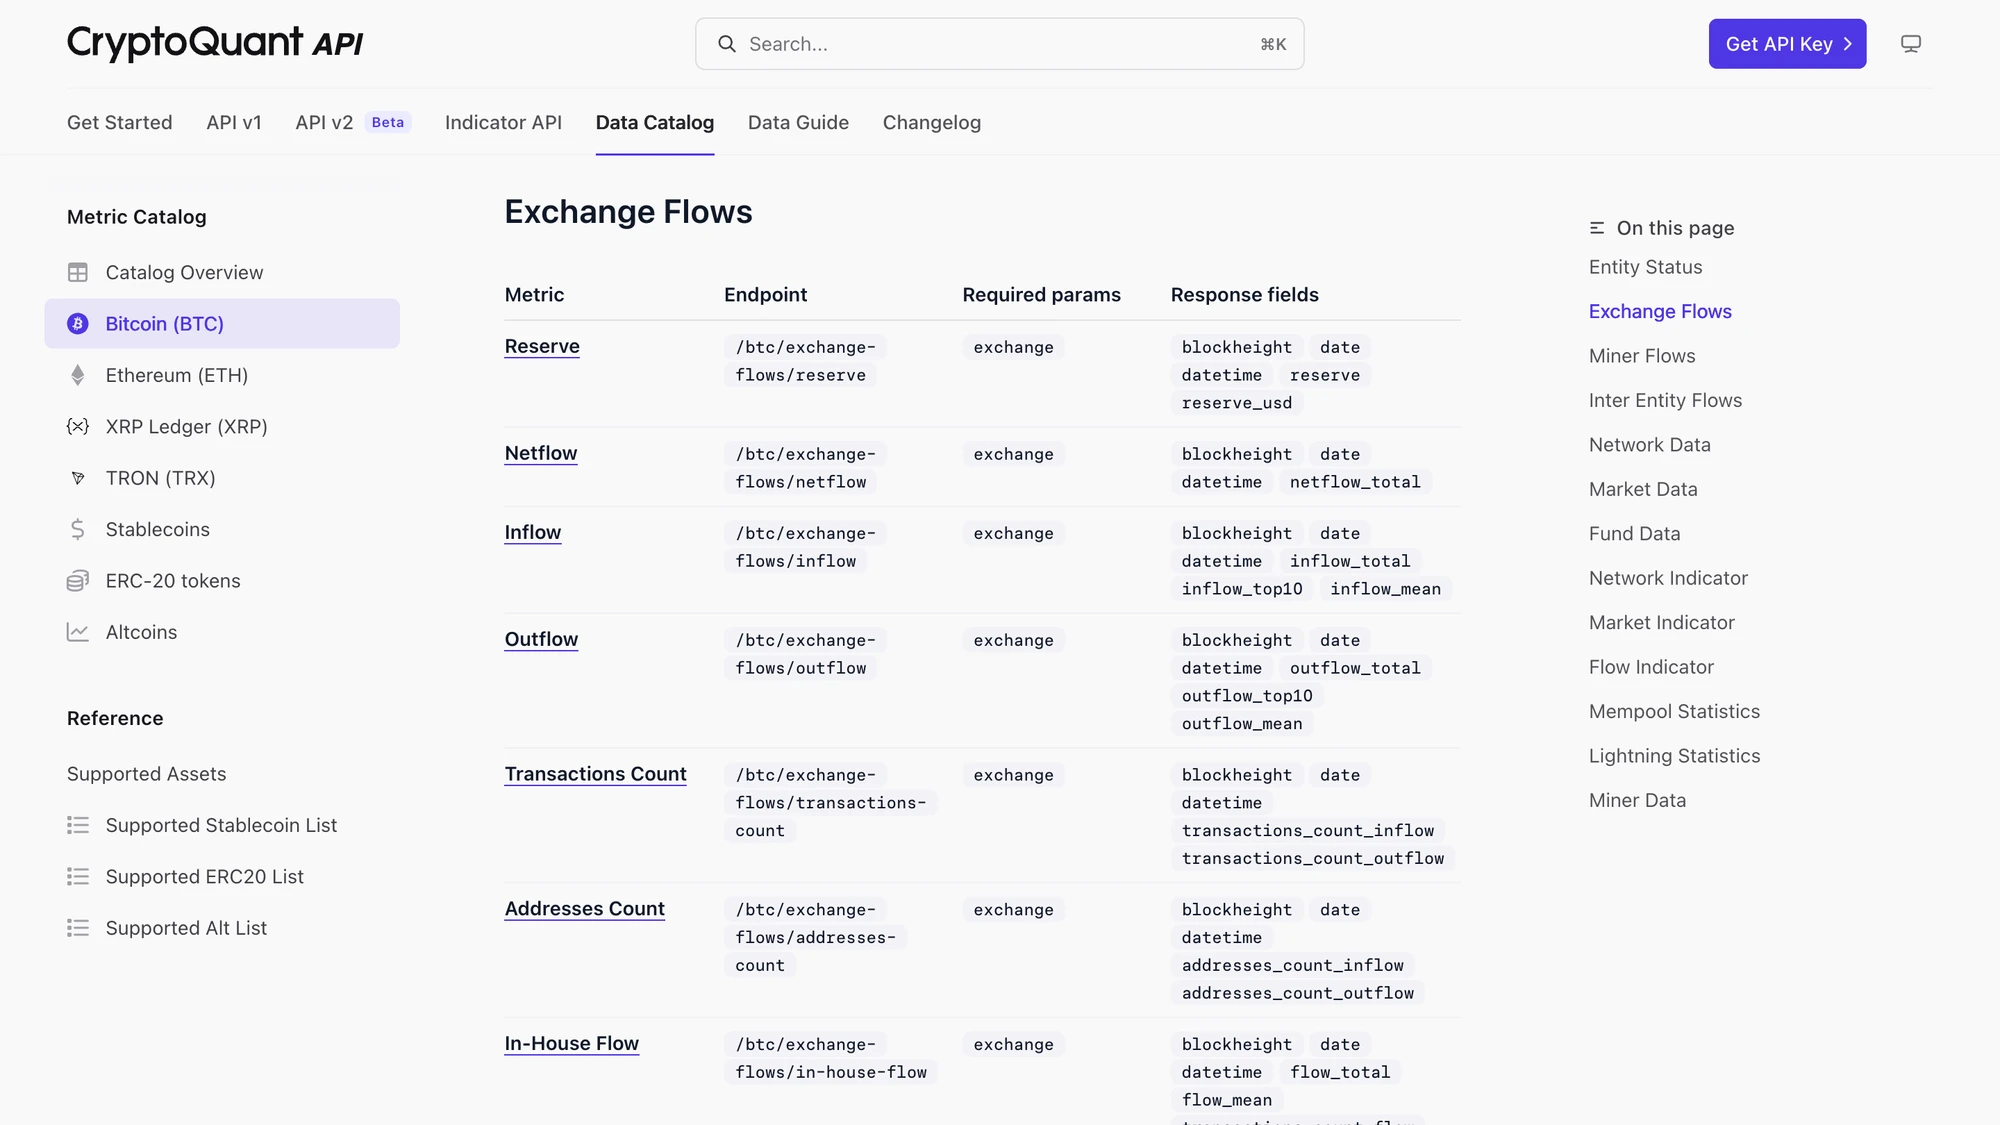
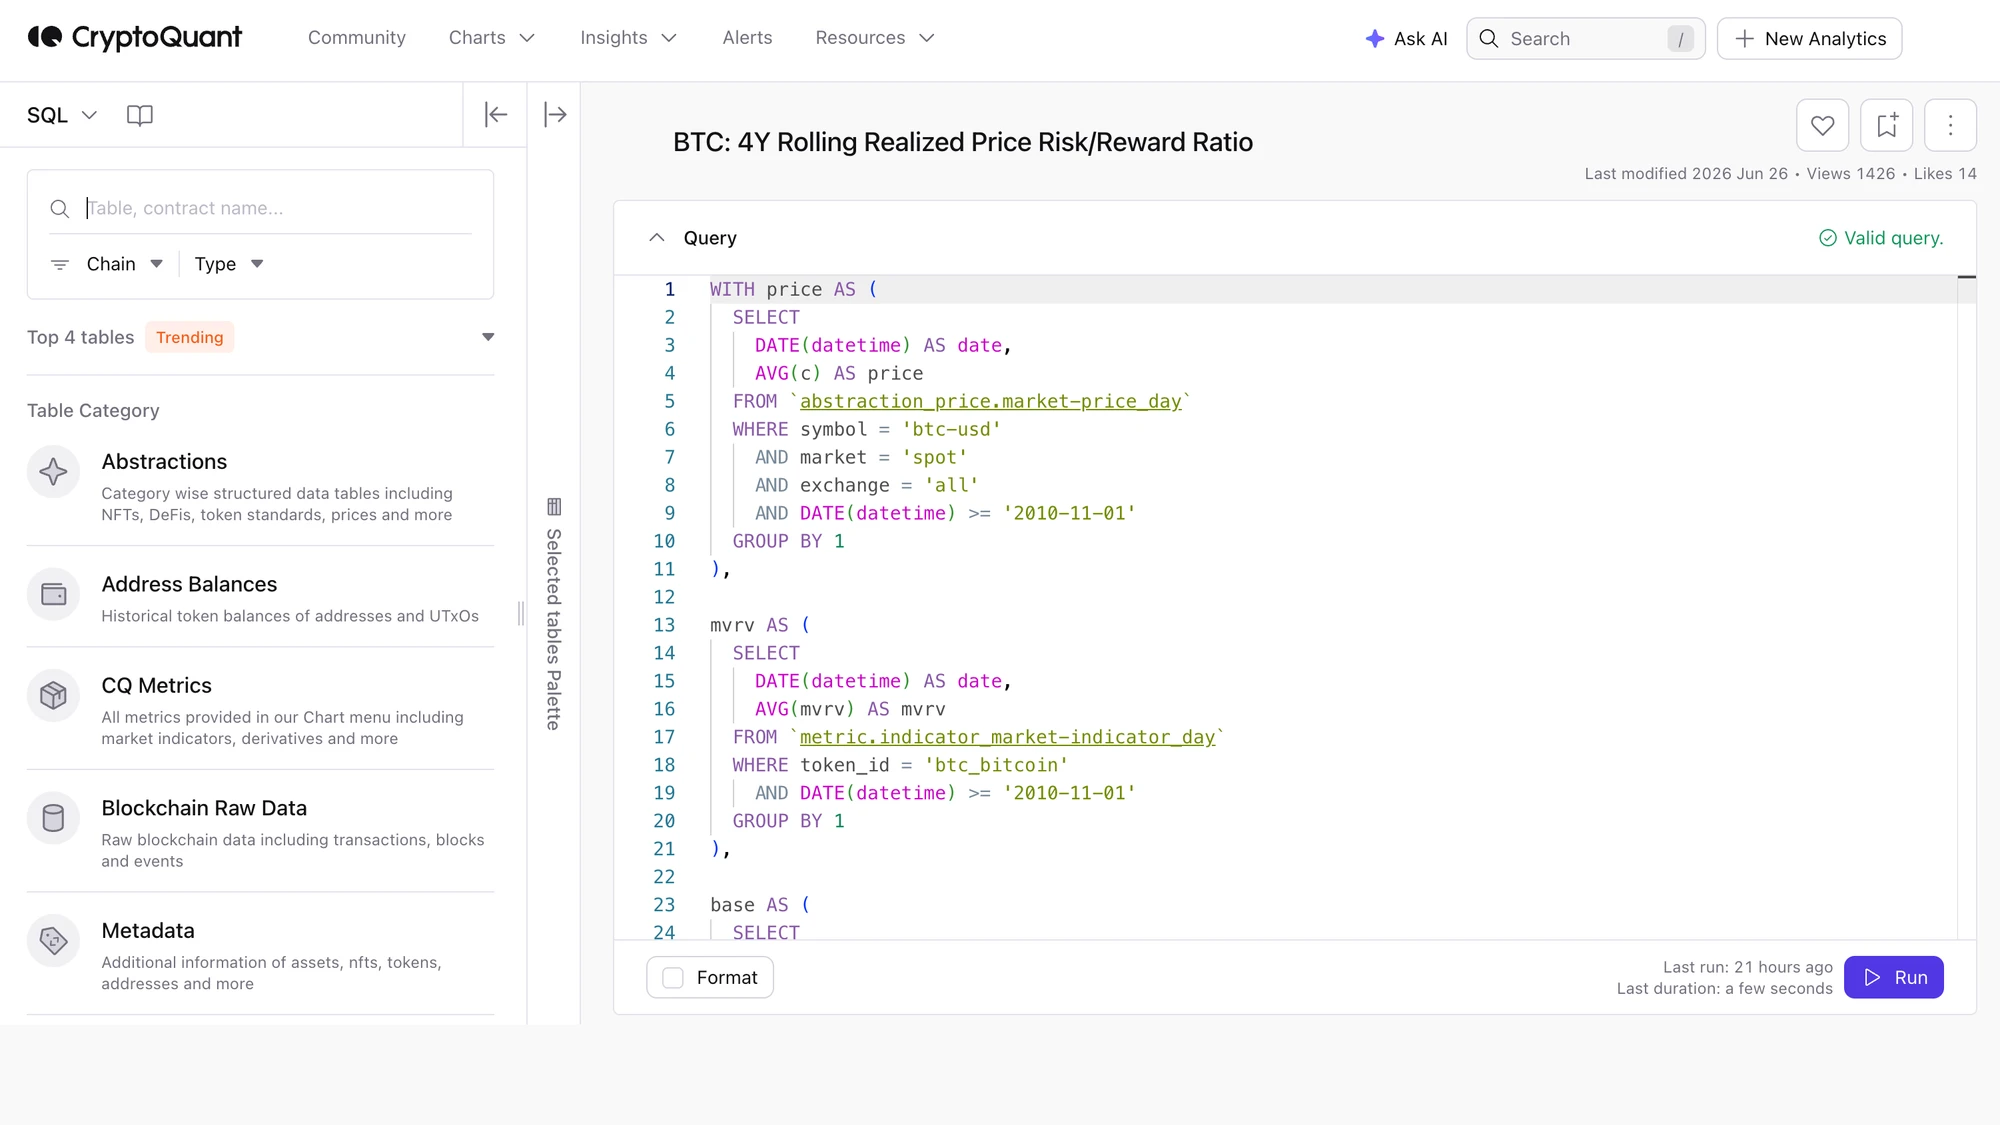
- Delivered by REST API, a remote MCP server for Claude, ChatGPT and other AI agents, in-app SQL queries and CSV export.
- Documented with data guides and the full data catalog.
- Day, hour and block windows, published latency per metric, billed in API credits.

Institutional-grade digital asset data.
CryptoQuant data is distributed through CME Group, integrated with Moody's, and cited in research by the Federal Reserve, J.P. Morgan, UBS and Bank of America. It sets a verifiable bar for an asset class where data quality varies widely.
- Distributed byCryptoQuant on CME DataMine
The first on-chain data provider for CME Group
CryptoQuant datasets have been distributed to institutional investors on CME DataMine since 2022.
- Federal Reserve
Cited in research bySource: Federal Reserve Bank of Kansas CityCited in Federal Reserve research and SEC filings
CryptoQuant data is cited in U.S. public-sector research and SEC filings.
- Integrated withSource: CoinDesk
On-chain insight provider on Moody's since January 2023
Integrated with Moody's terminal to deliver on-chain data insights.

Every dataset a crypto desk needs,
from raw blockchain data to indicators.
Market data, on-chain metrics, analyst sentiment and per-asset indicators across multiple blockchain networks, all from one API.
- Market data
Spot and derivatives market data, per exchange.
Prices, trades, funding rates, open interest and liquidations, per exchange or aggregated, down to the minute. Use it for price action and technical analysis alongside on-chain signals.
View docs - On-chain flows
Exchange flows from labeled wallets.
Exchange, miner, whale and fund flows and reserves are computed per block from blockchain addresses that CryptoQuant labels, maintains and corrects. Rising exchange inflows are often read as sell-side pressure, and sustained outflows as accumulation.
View docs - Sentiment
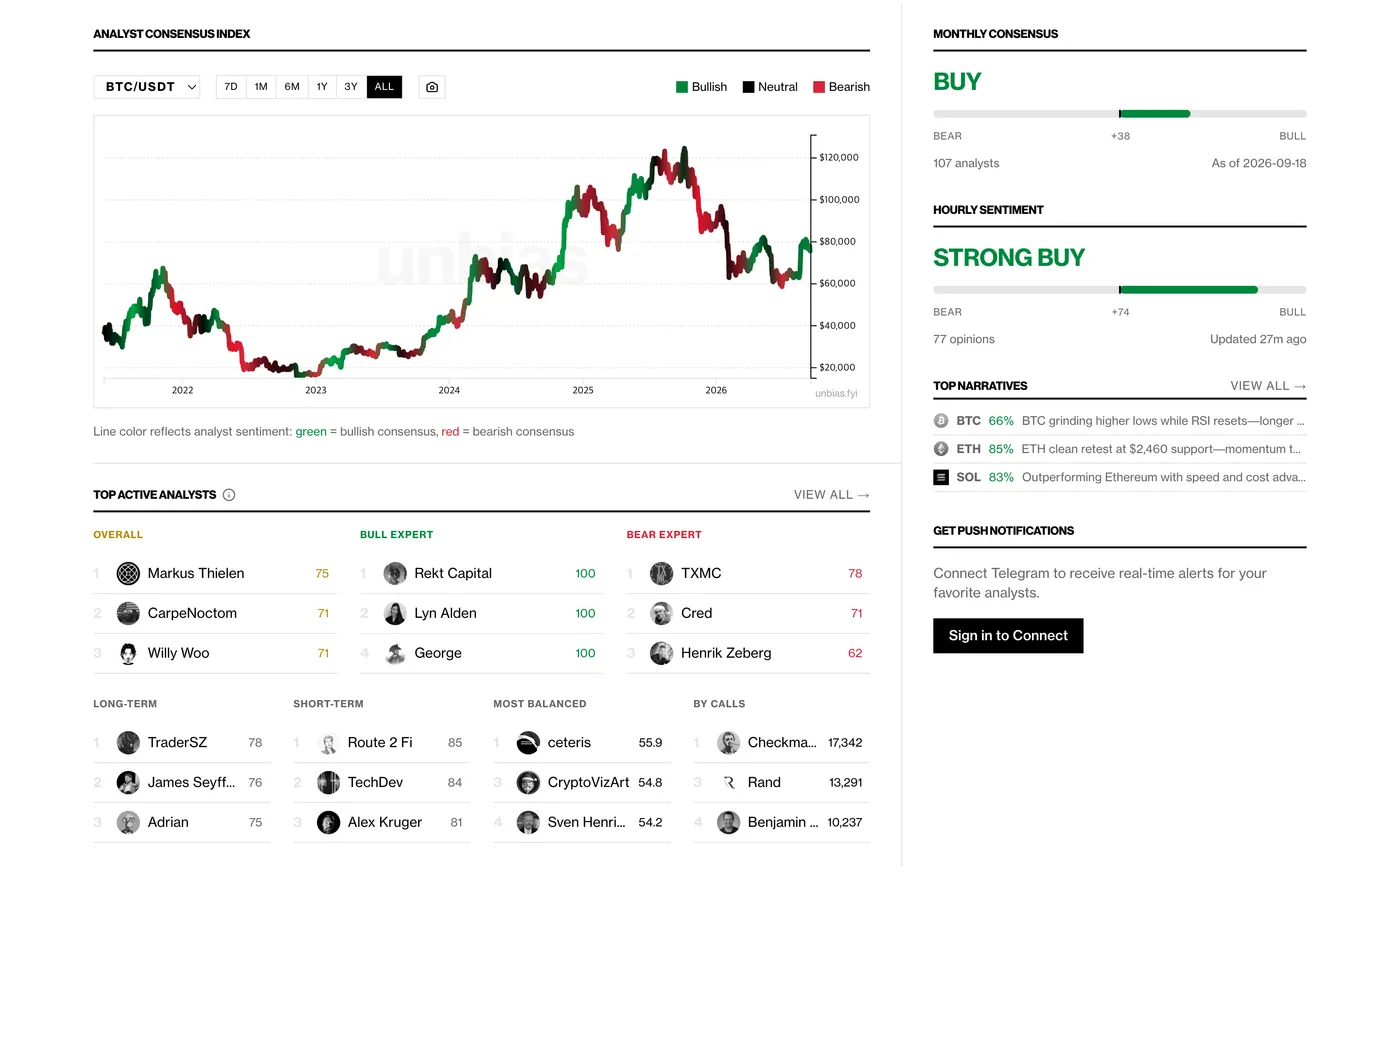
Analyst Consensus: sentiment from the analysts themselves.
A daily index of bullish and bearish calls from tracked crypto analysts, with the original posts linked. It measures market sentiment at the source rather than inferring it from social volume.
View docs - Indicators
Indicators and network data, bundled per asset.
Valuation metrics such as MVRV (market value to realized value) and SOPR, network health signals such as transaction volume and transaction activity, and holder behaviour for short-term and long-term holders. Each metric is documented with its historical thresholds.
View docs
One data catalog, delivered in the app, by REST API and by MCP.
From pre-built charts to your own analysis.
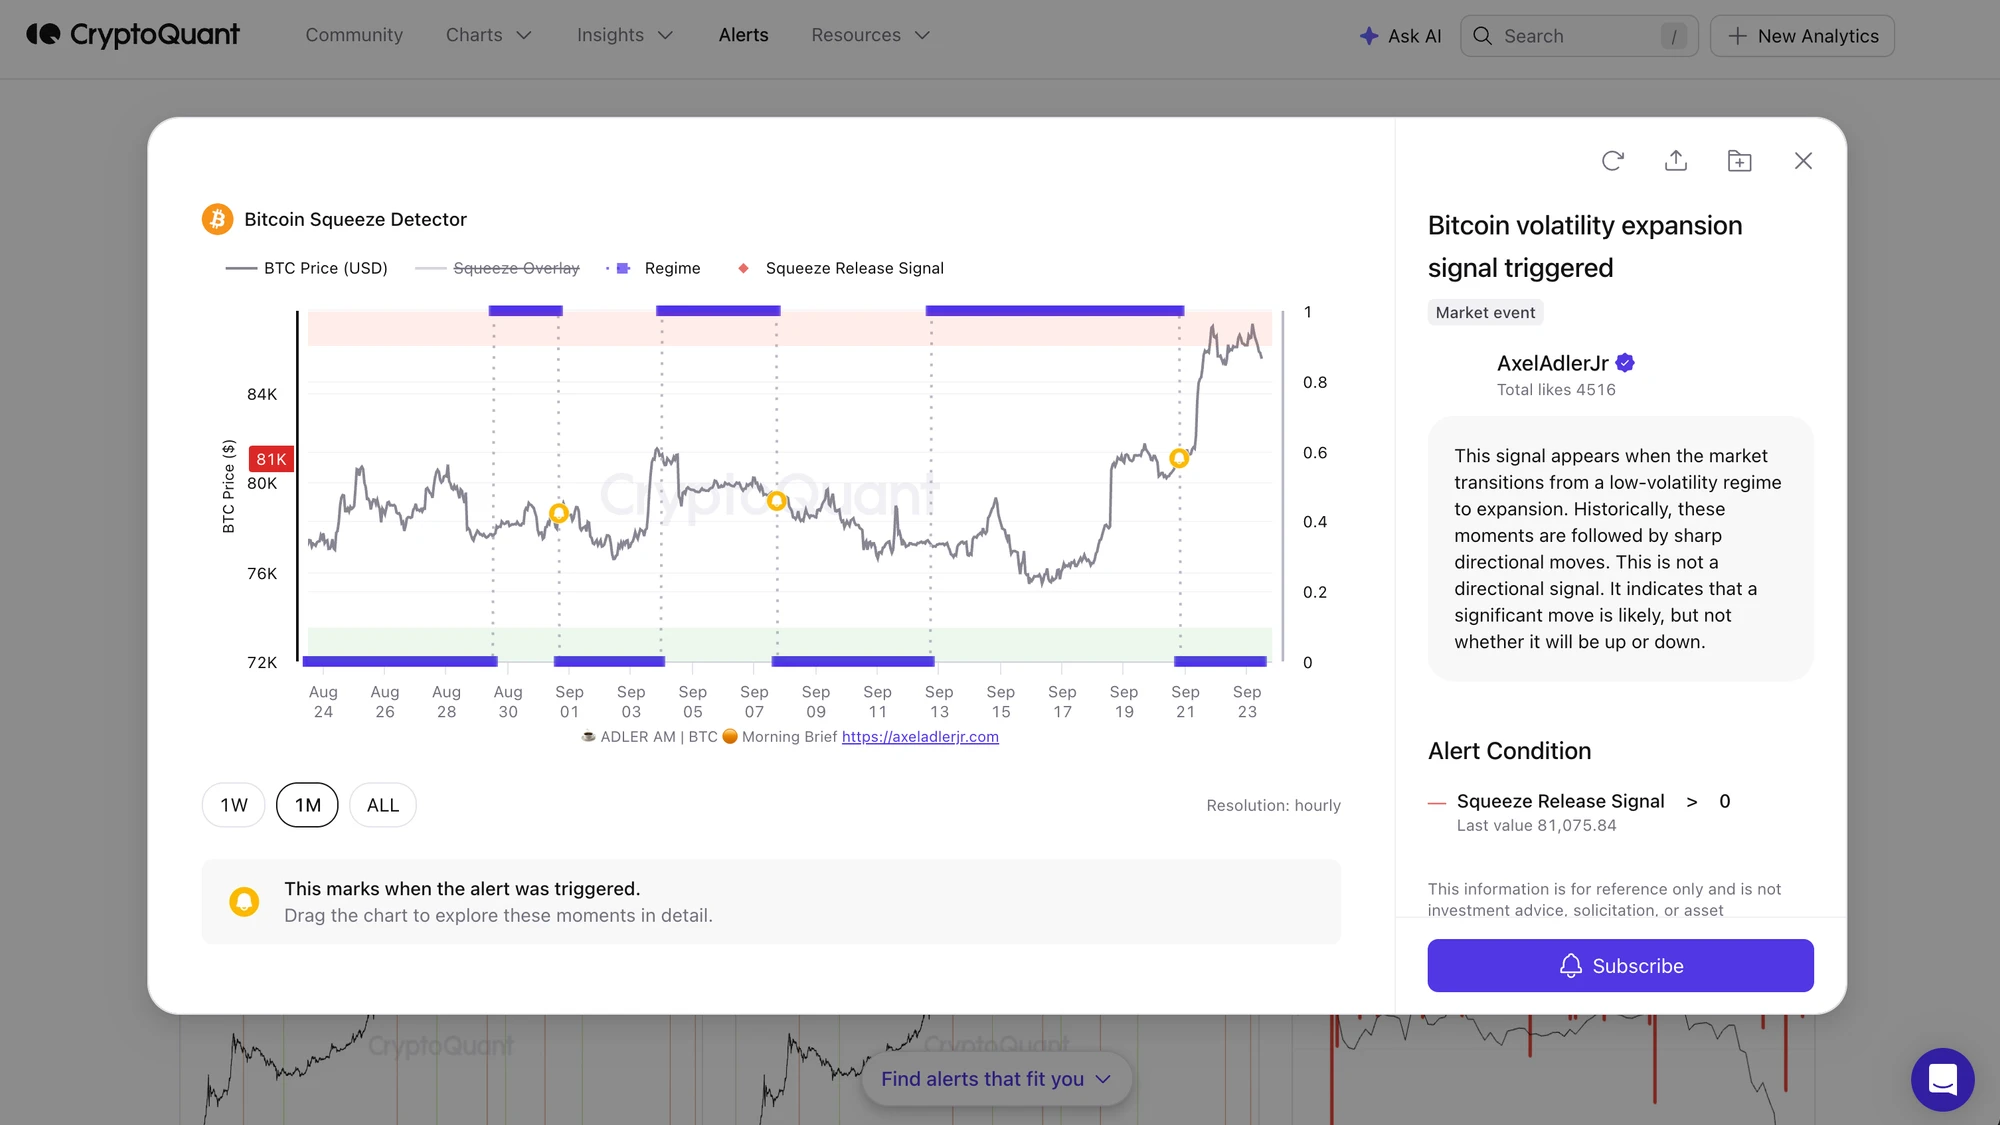
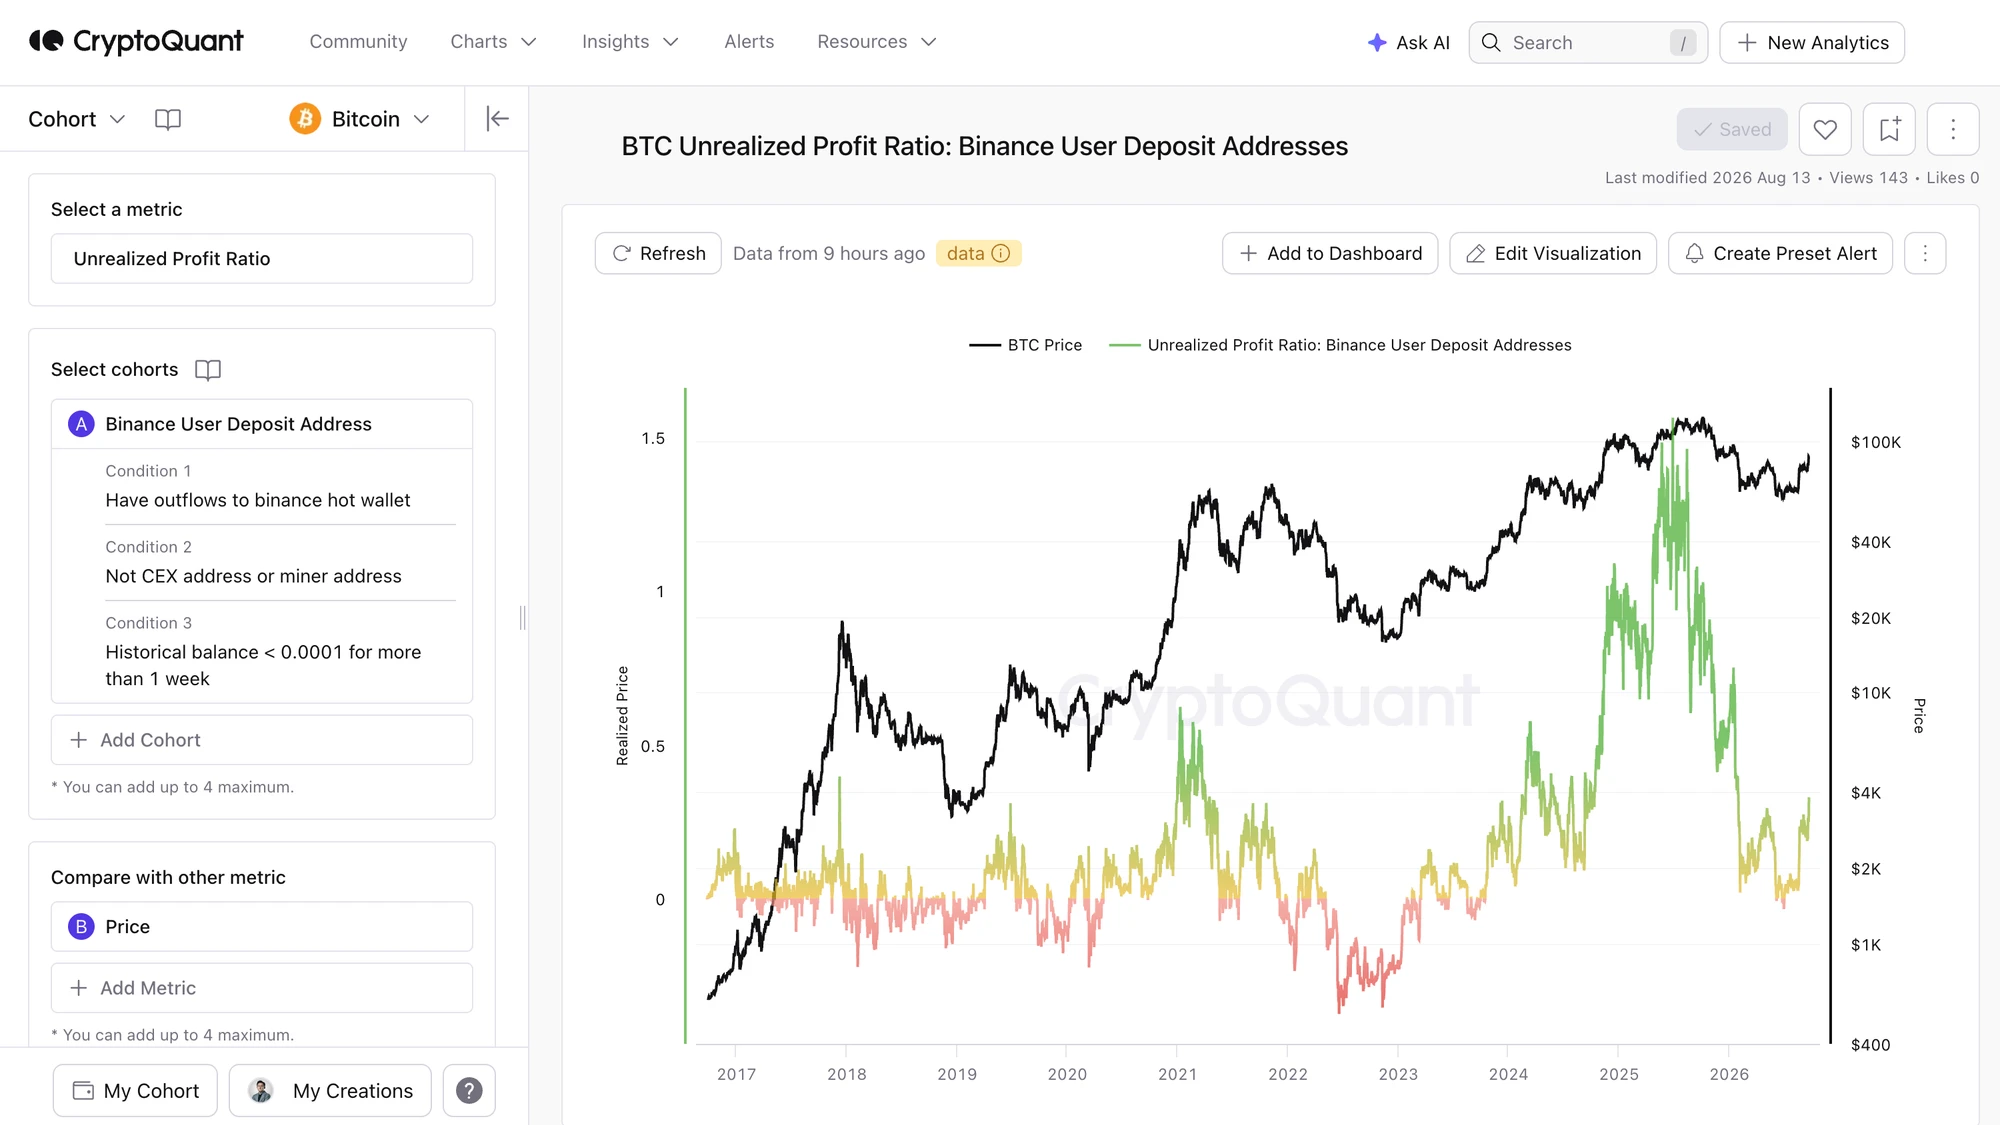
Chart on-chain and market data, query it in SQL, group blockchain addresses into cohorts and set real-time alerts. These are the building blocks for data-driven decisions.
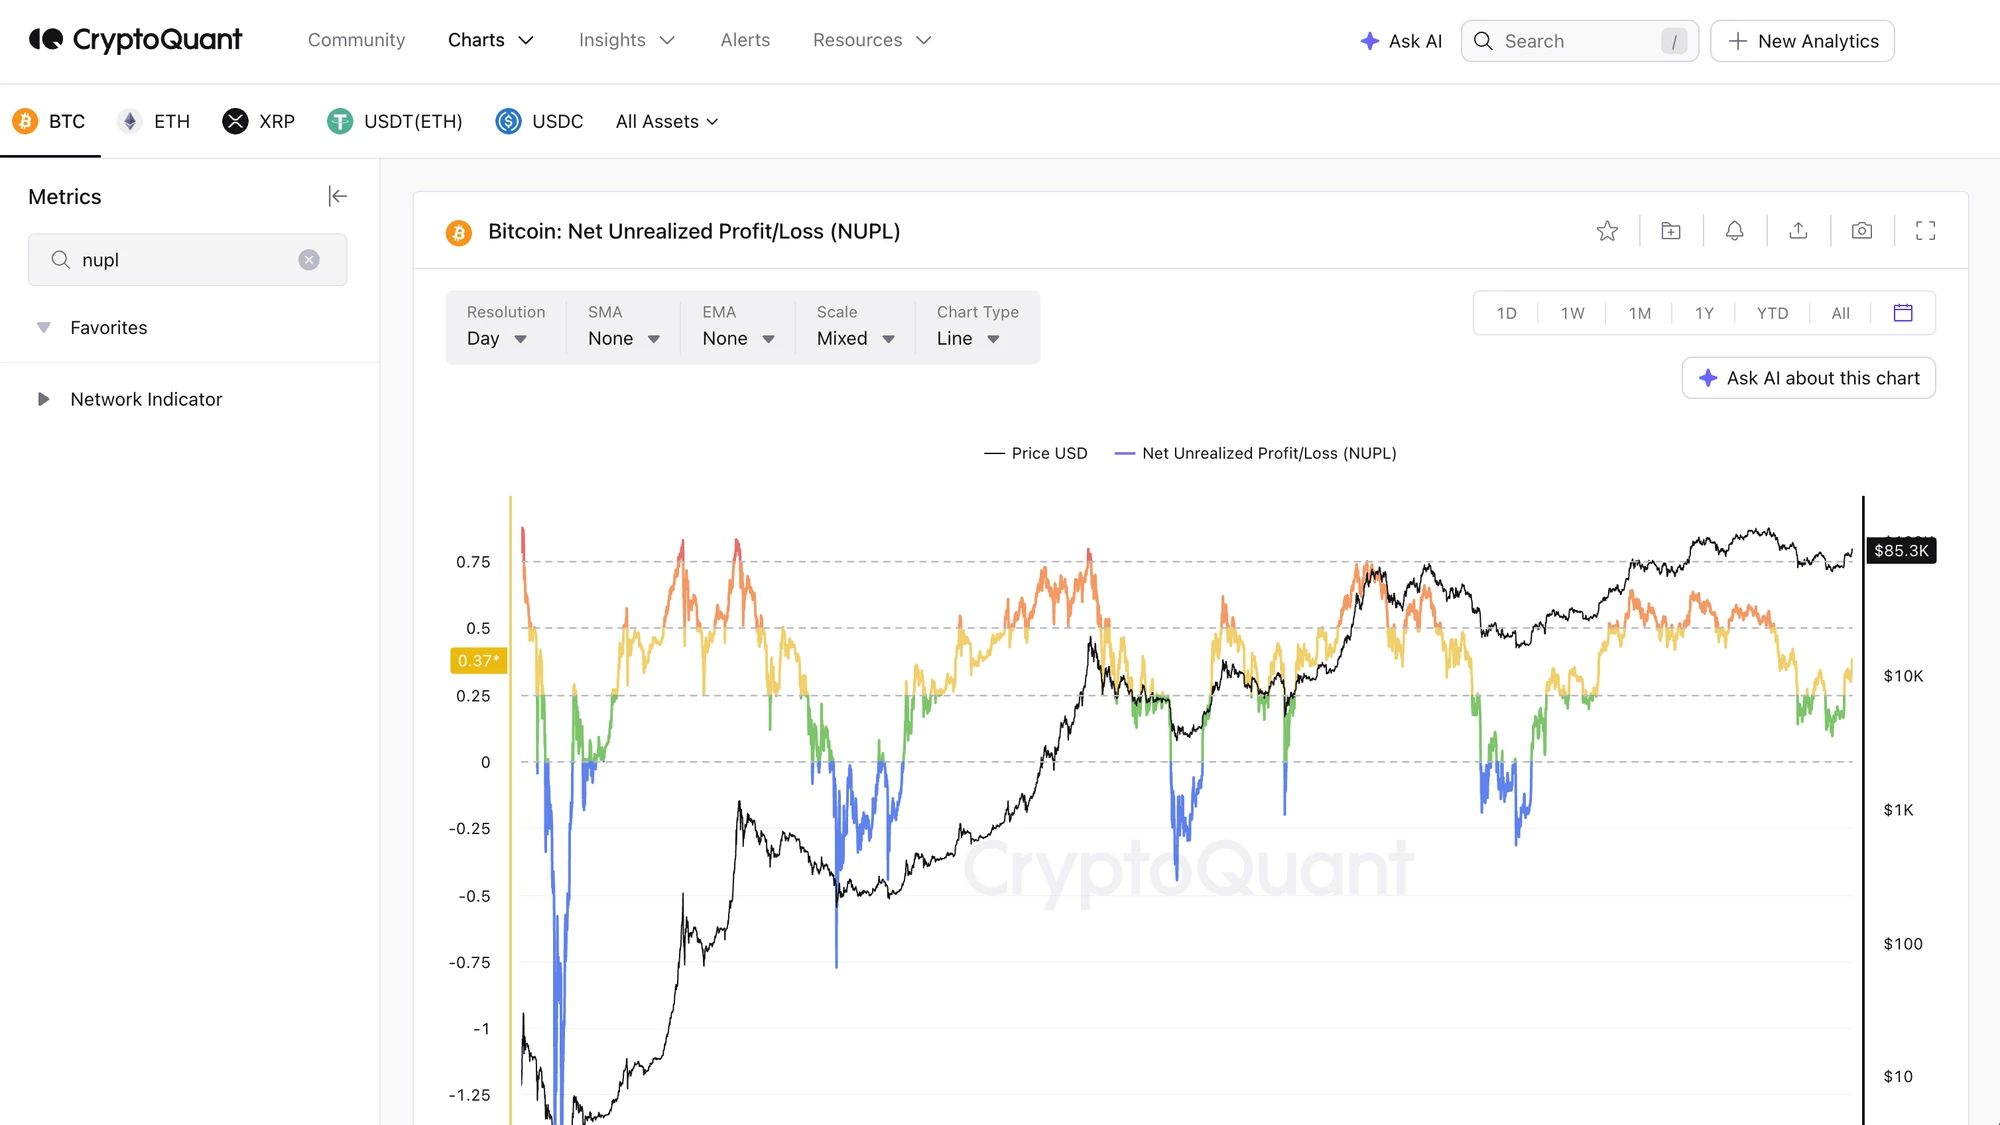
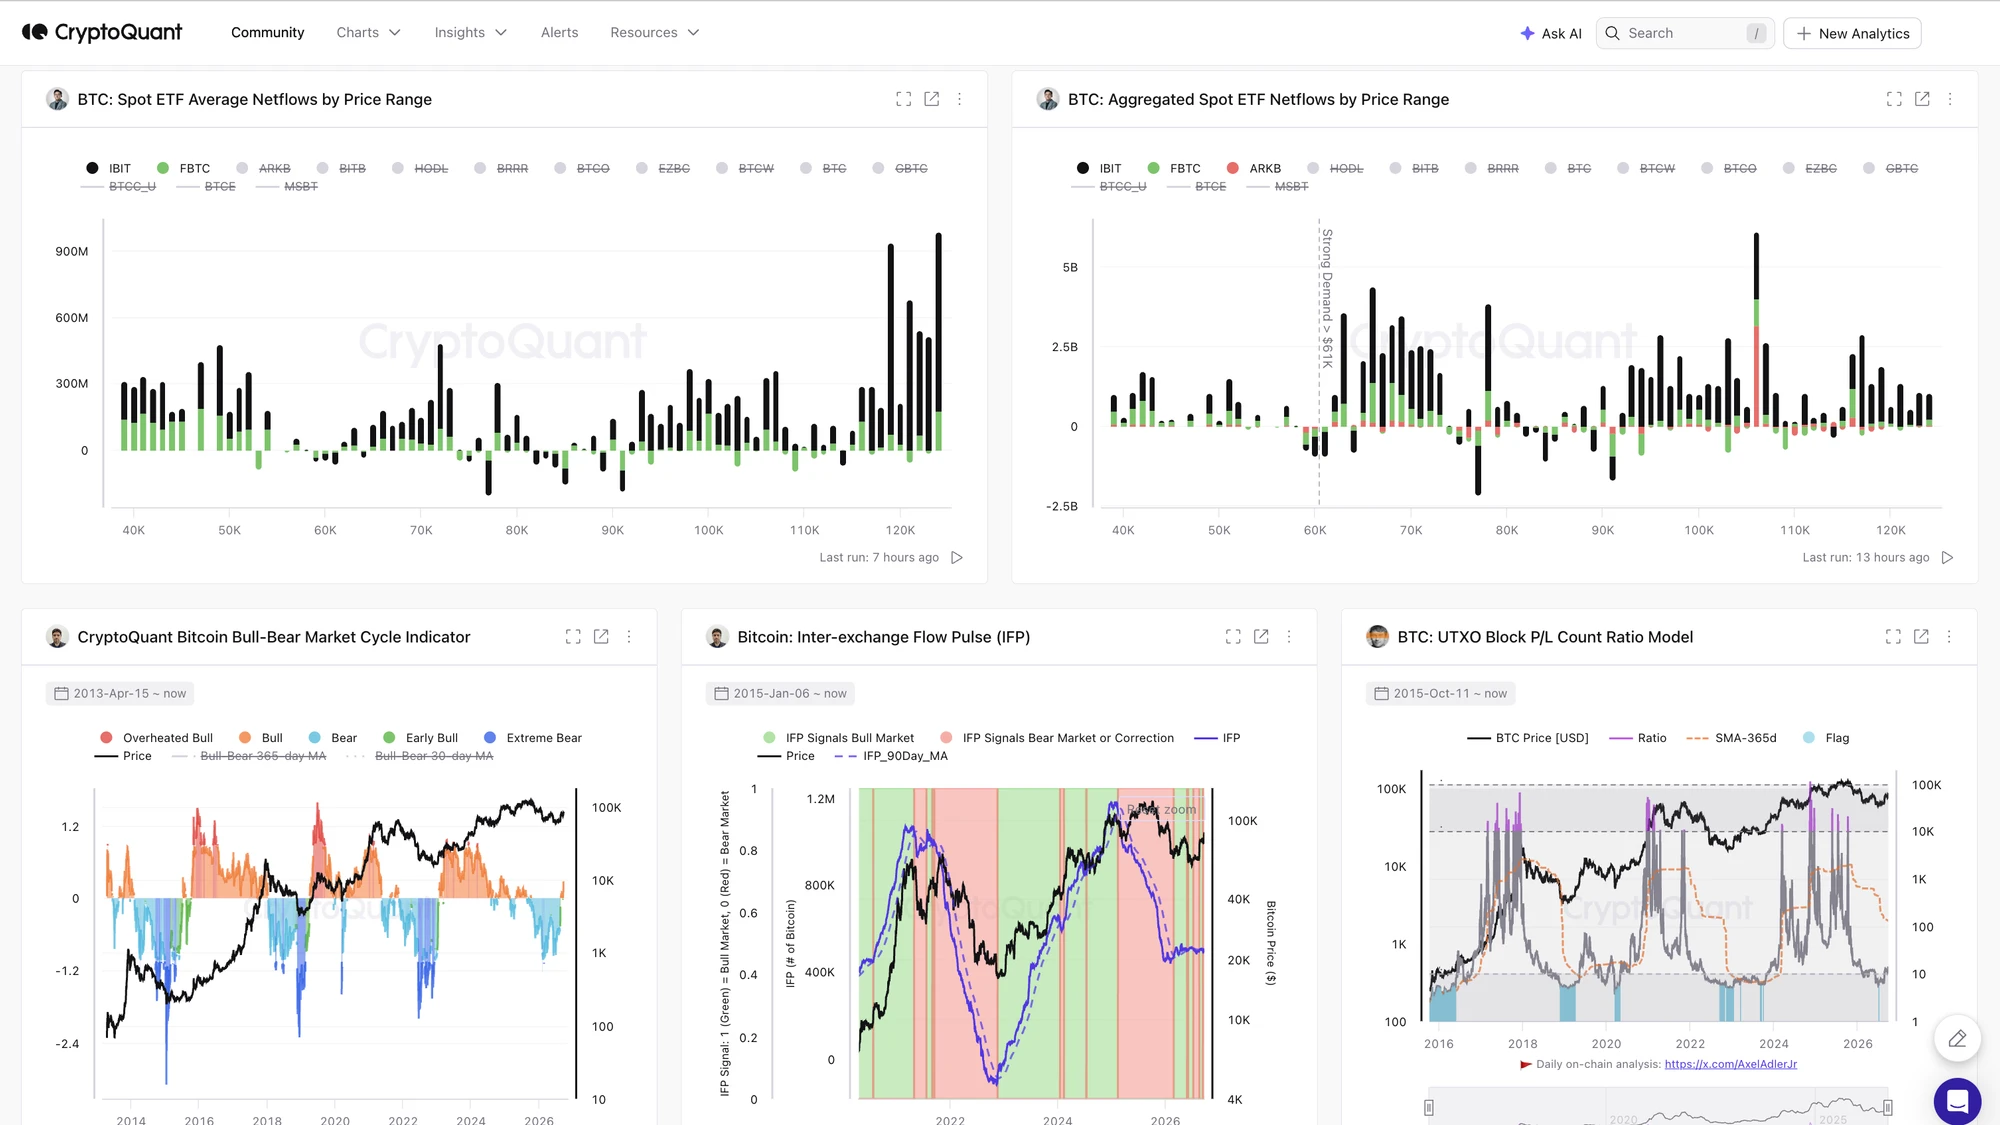
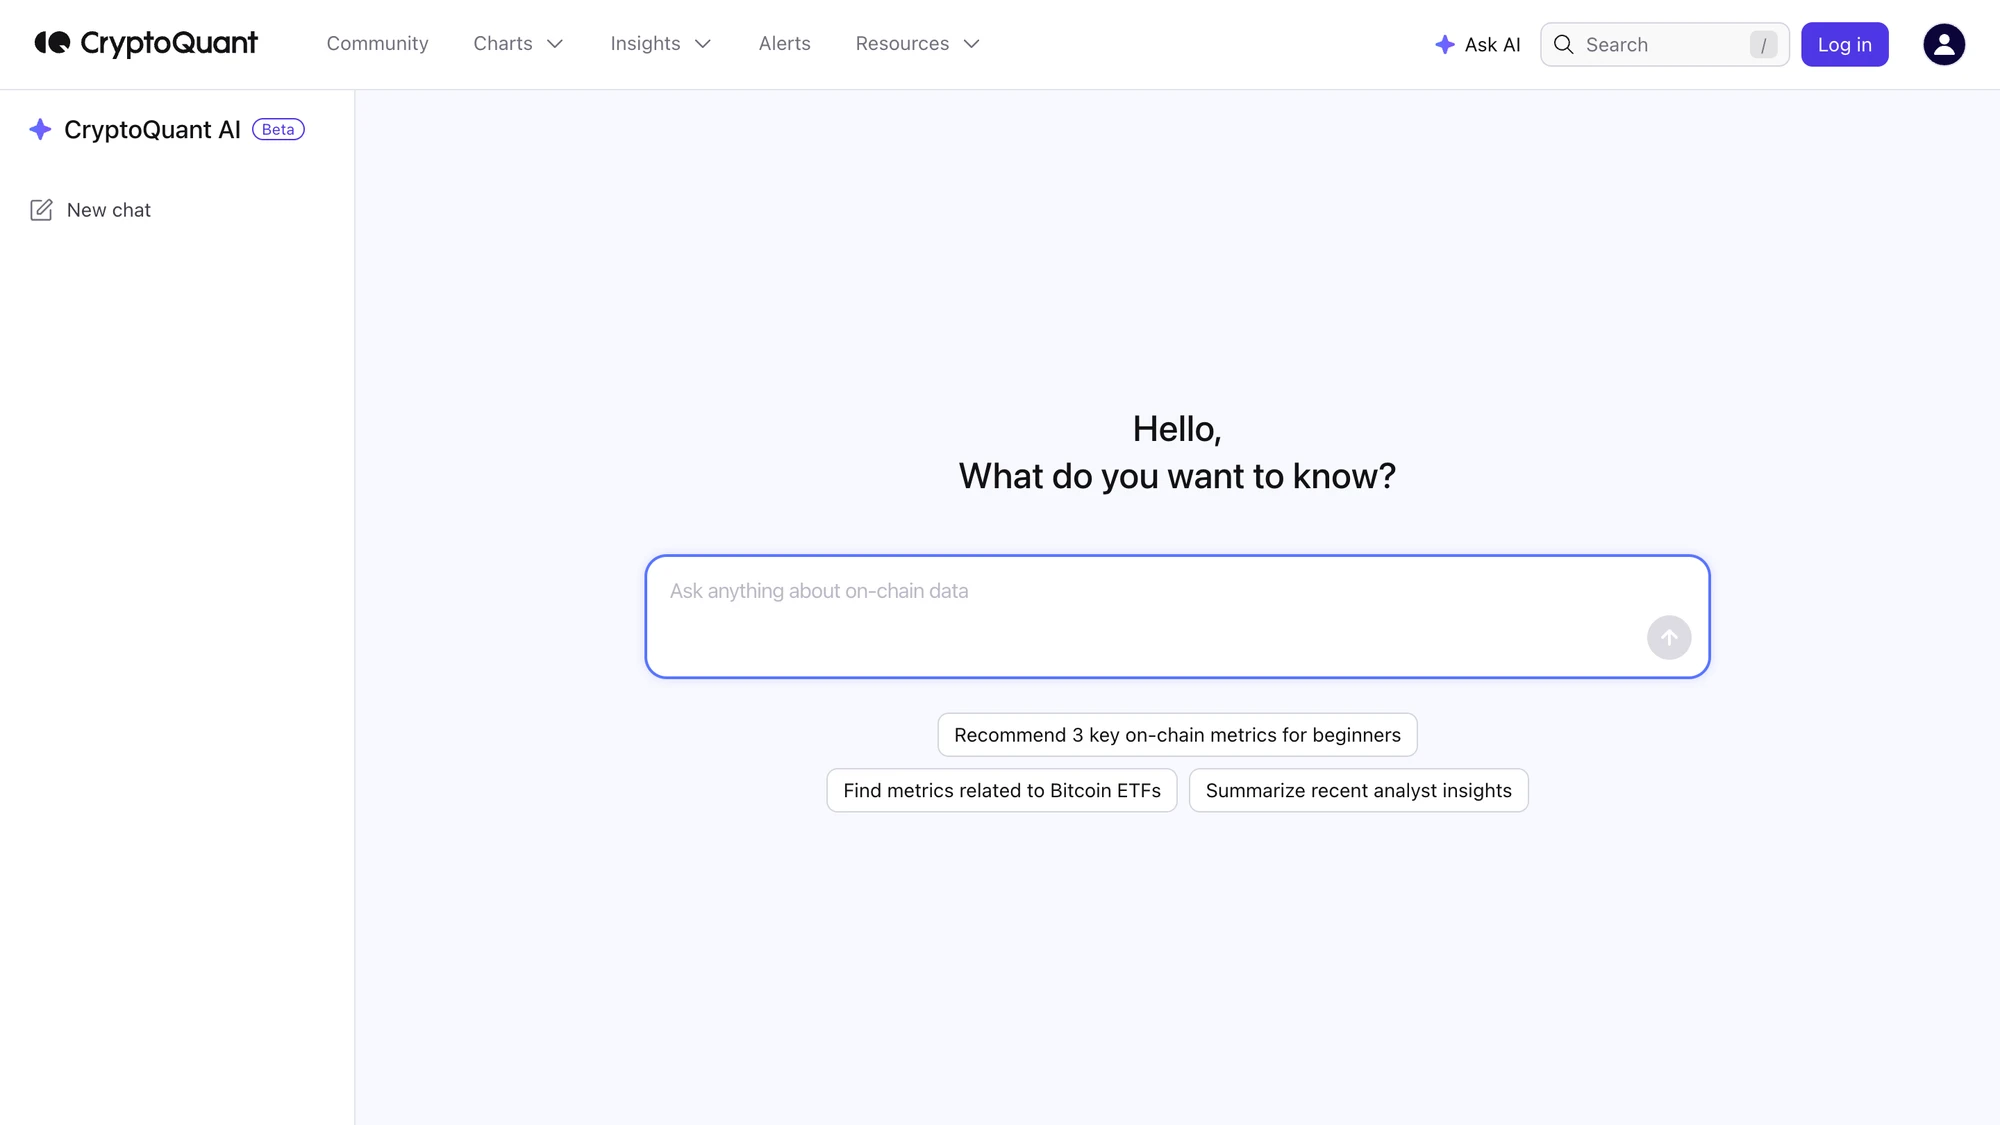
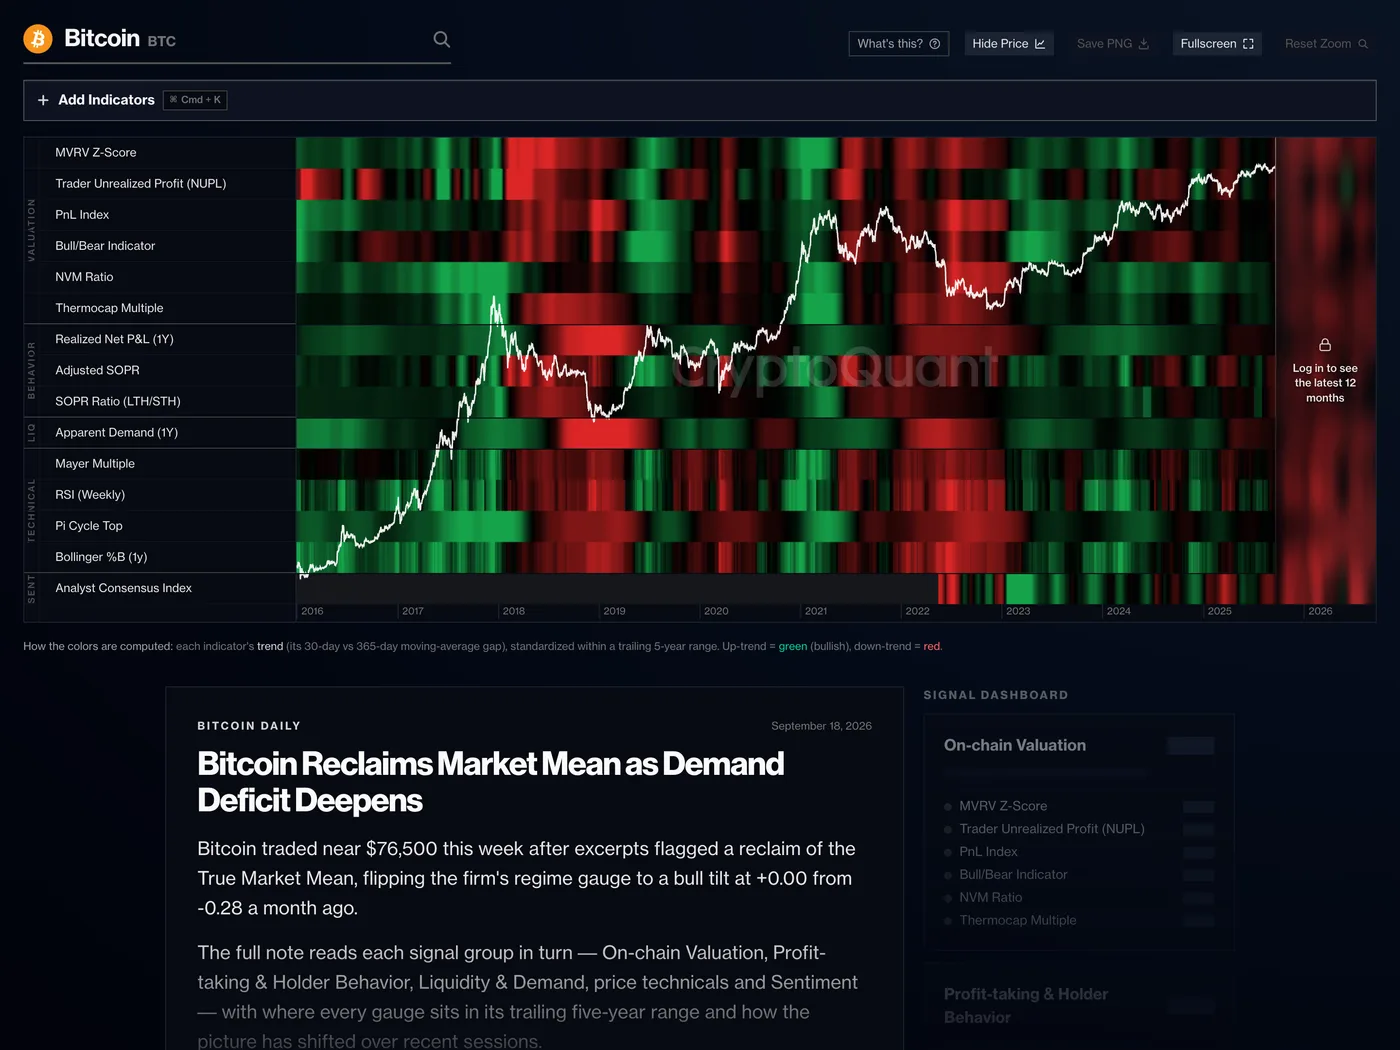
Bitcoin and crypto on-chain indicators, built by traders.
Turn any query, SQL or no-code, into a public indicator others can use.
3,803 indicators from 472 authors, cited 59,380 times.
On-chain research and content,
built for your business.
Work with CryptoQuant on analyst-led content, custom research and advertising. Talk to our team about the scope and delivery that fit your needs.
Analyst Bounty Program
Work with CryptoQuant's analyst network on data-driven content for your project or exchange.
Research & Reporting
Commission on-chain research on your ecosystem, or bring blockchain analysis into your own reports.
Advertising
Reach crypto traders and institutional investors through CryptoQuant advertising and sponsorships.
The on-chain data source the press cites.
- Financial Services Roundup: Market Talk
- Bitcoin Whales End Selling Spree, Adding $2.9 Billion in 60 Days
- Strategy should halt bitcoin buys and bolster cash reserves, CryptoQuant says
- Bitcoin Falls Below $75,000 Before Clarity Act Stumbles
- 3 reasons Bitcoin is stuck in a bear market—and why one analyst predicts a rebound to $100,000 by year-end
- Bitcoin whale that sat through the March 2020 crash moves $378 million
- CryptoQuant says bitcoin correction could be near as traders' unrealized profit hits 21-month high
- The Amount Of Bitcoin On Exchanges Is Shrinking
Frequently asked questions
What is CryptoQuant?
CryptoQuant is an on-chain data and crypto market analytics provider founded in 2018. It serves traders, institutional investors and developers through charts, dashboards, alerts, a REST API and a remote MCP server. Its data is distributed through CME Group and cited by the Federal Reserve.
What is on-chain data?
On-chain data is information recorded on a blockchain's public ledger, including transaction records, wallet balances and smart contract activity. Because public blockchains are transparent and confirmed records can't be altered, anyone can verify it without a central authority. CryptoQuant turns raw blockchain data into on-chain metrics such as exchange flows, reserves and holder behaviour.
What is on-chain analysis, and how does it differ from technical analysis?
Technical analysis studies price action and volume. On-chain analysis is a form of fundamental analysis. It examines what holders, exchanges, miners and whales are actually doing on the blockchain, which helps estimate intrinsic value and market dynamics that traditional metrics can't capture. Most crypto traders use both.
What do exchange flows tell you about market sentiment?
Coins moving onto exchanges are often a precursor to selling, so rising inflows are typically read as bearish. Sustained outflows suggest investors are moving coins into custody, which is typically read as bullish. Whale transactions carry more weight, because large holders can move price and trading volume.
Is there an API, and does it work with AI tools like Claude?
Yes. The REST API covers 245+ metrics across Bitcoin, Ethereum, XRP, TRON, stablecoins, ERC-20 tokens and altcoins. The remote MCP server connects Claude, Cursor or any MCP-capable client, so you can ask about exchange flows, miner activity and market indicators in plain language. It gives your assistant nine tools: five for querying data, and four for searching CryptoQuant research and QuickTake posts from Verified Authors. MCP uses the same plan, credits and limits as the API.
What market data is in the API besides on-chain metrics?
Spot and derivatives data per exchange or aggregated: prices, trades, funding rates, open interest and liquidations, down to the minute.
How much history do I get, and at what resolution?
It depends on the plan: Basic (free): 30 days of market data at daily resolution. Advanced: one year of market data at hourly resolution. Professional: one year of history, with market data down to the minute and on-chain data at daily resolution. Premium: full history at every available window, including hourly, 10-minute and per-block on-chain data.
When is a data point published, and can it change later?
Every endpoint exposes a latency check that reports two delays per resolution: network (block) delay and processing delay. It also carries a flag showing whether values already served may still be revised. CryptoQuant doesn't use the most recent block, which avoids errors from blockchain reorganisations and keeps data consistent over time. End-of-day exchange, miner and inter-entity flow data starts serving at 00:00 UTC and is final by 01:00 UTC.
How do I receive real-time alerts?
Set preset or custom alerts on any metric and receive them by email or Telegram, including alerts on fund movements and whale transactions.
Can I publish or sell what I build on the data?
Redistribution licensing is available on enterprise plans. Talk to sales.
What do institutions get?
Enterprise plans with custom data delivery and redistribution licensing, applied research and white-label reporting, and a dedicated account manager.
Is there a free plan?
Yes. The Basic plan is free, with 10,000 monthly API credits, market data at daily resolution and 30 days of history. On-chain data starts on the Professional plan.