
Bitcoin Whale Ratio: Tracking Large Exchange Deposits
CQ Insights
Since 2020, BTC returned a median −1.2% in the 30 days after a Bitcoin whale ratio spike, against +1.9% for all days. Location decided most of it. Spikes within 5% of the 30-day price high were followed by a median −4.5%, and spikes more than 10% below it by +3.2%.
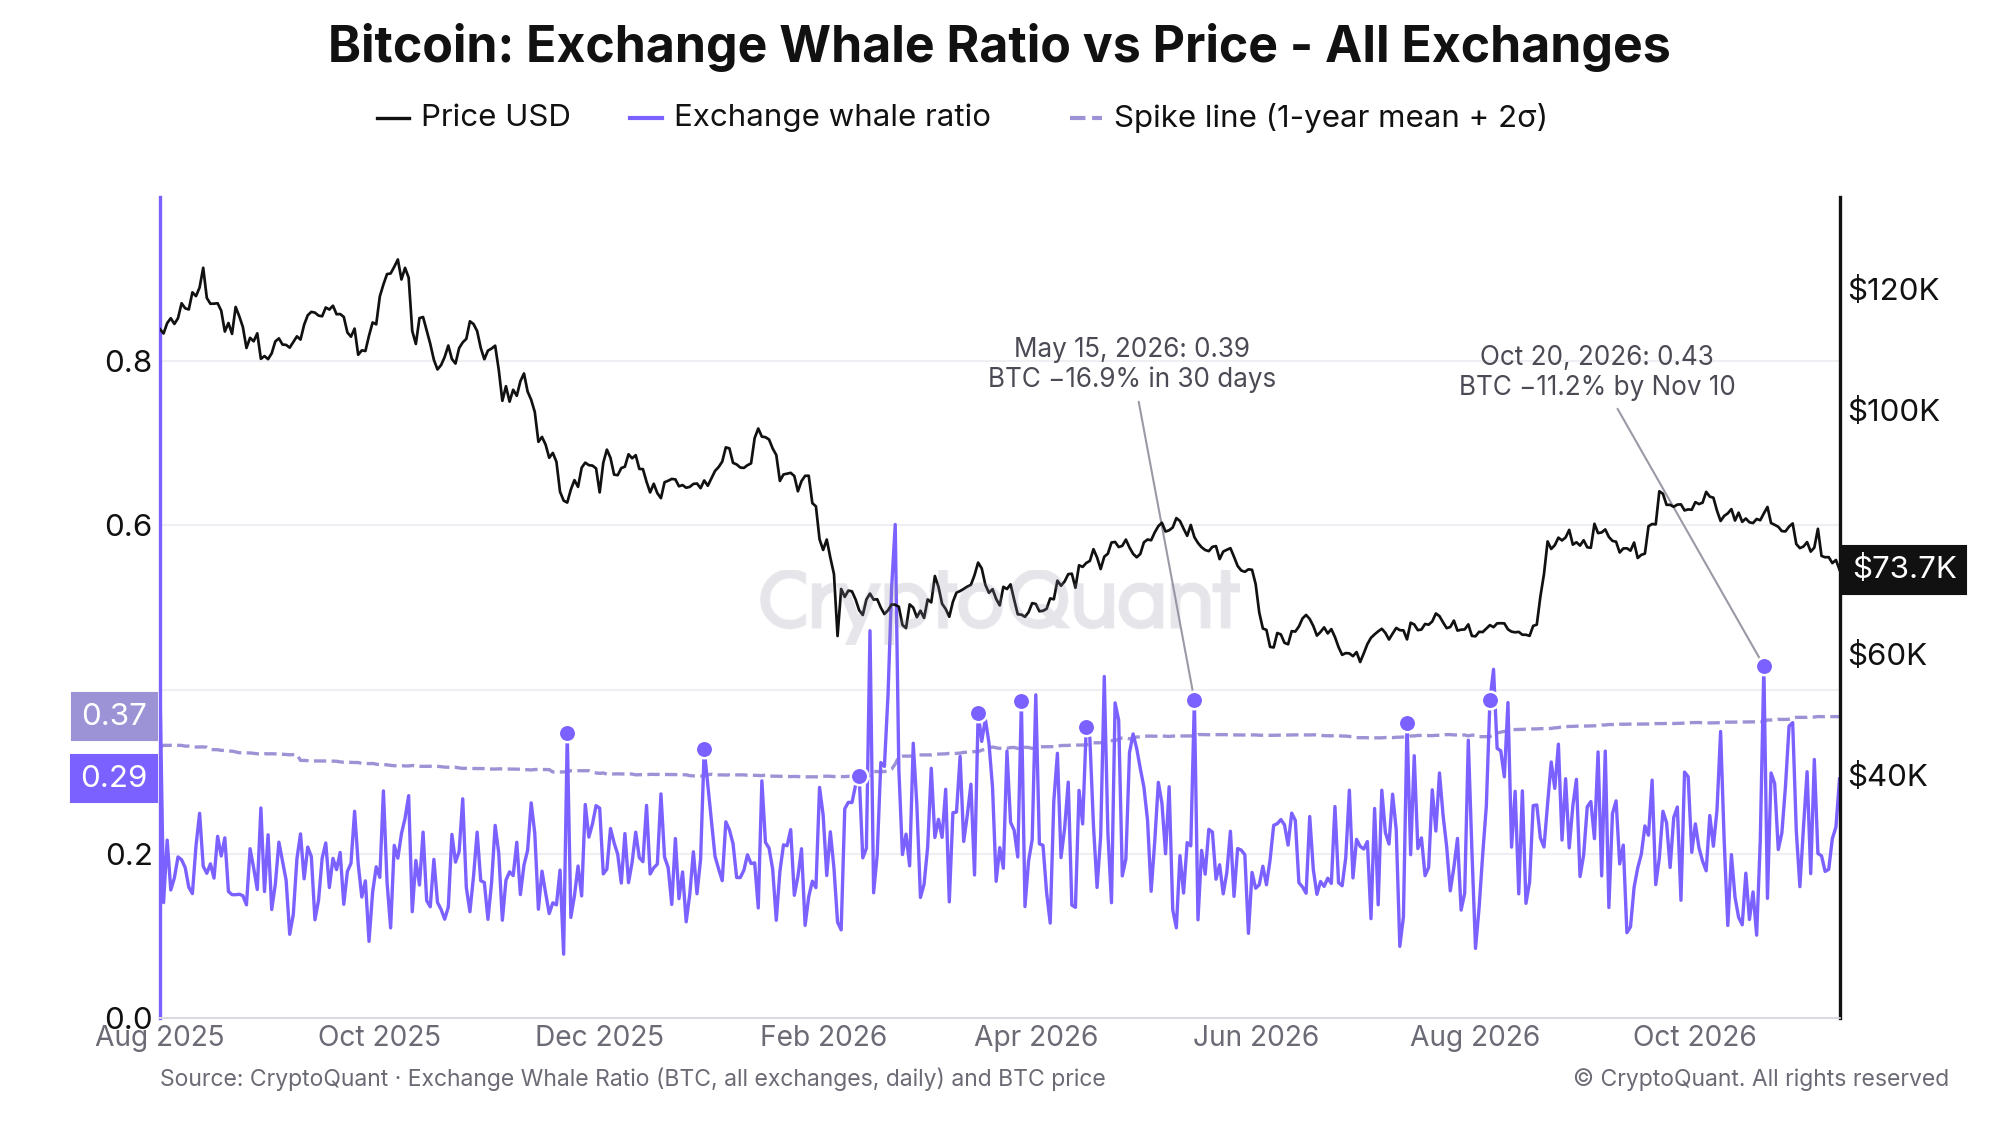
Exchange whale ratio (purple) with its spike line (dashed) against the BTC price (black), August 2025 to November 10, 2026. The spike on May 15, 2026 at 0.39 was followed by a 16.9% decline in 30 days. Source: CryptoQuant.
The Bitcoin whale ratio, explained
The exchange whale ratio is the ten largest deposits to exchanges in a day divided by the total exchange inflow. On November 10, 2026, the ten largest inflows carried 14,039 BTC out of 48,183 BTC deposited, a ratio of 0.29. The exchange whale ratio user guide covers the calculation.
Inflow tells you how much arrived. The whale ratio tells you how concentrated it was. Between January 1, 2020 and November 10, 2026, the median all-exchange ratio was 0.19. It closed above 0.35 on 146 days, or 5.8% of the time. Our exchange netflow playbook uses the ratio as a filter on inflow spikes. This post tests the ratio as a signal in its own right.
What the backtest shows
The test uses the daily all-exchange whale ratio and the BTC price from January 1, 2020 to November 10, 2026. A spike is a day when the ratio closes more than two standard deviations above its mean of the previous 365 days. At today's levels that is a reading above 0.367. Spikes within seven days of each other count once, which turns 131 spike days into 60 events. Returns run from the day's close.
Setup | Days or events | 7-day median | 30-day median | Up after 30 days | 90-day median |
|---|---|---|---|---|---|
All days (baseline) | 2,506 | +0.5% | +1.9% | 56% | +7.2% |
Whale ratio spike (two sigma) | 60 | −0.1% | −1.2% | 46% | −7.6% |
Spike within 5% of the 30-day high | 31 | −1.1% | −4.5% | 37% | −7.8% |
Spike more than 10% below the high | 23 | +1.0% | +3.2% | 57% | −9.7% |
Spike on a net inflow day | 38 | +0.4% | −3.2% | 43% | −9.7% |
Spike on a net outflow day | 22 | −0.2% | +0.9% | 50% | −4.4% |
Spike near the high on a net inflow day | 17 | −2.6% | −6.0% | 31% | −15.2% |
Ratio above 0.35, every day | 146 | +0.2% | −0.3% | 48% | −0.4% |
A spike alone is three percentage points below the baseline at 30 days. Location and netflow do the sorting. The split rows have between 17 and 38 events, so treat them as tendencies, not rules. Every spike row is negative at 90 days against +7.2% for all days, but 15 of the 60 events fell in 2022, so that column leans on one bear market.
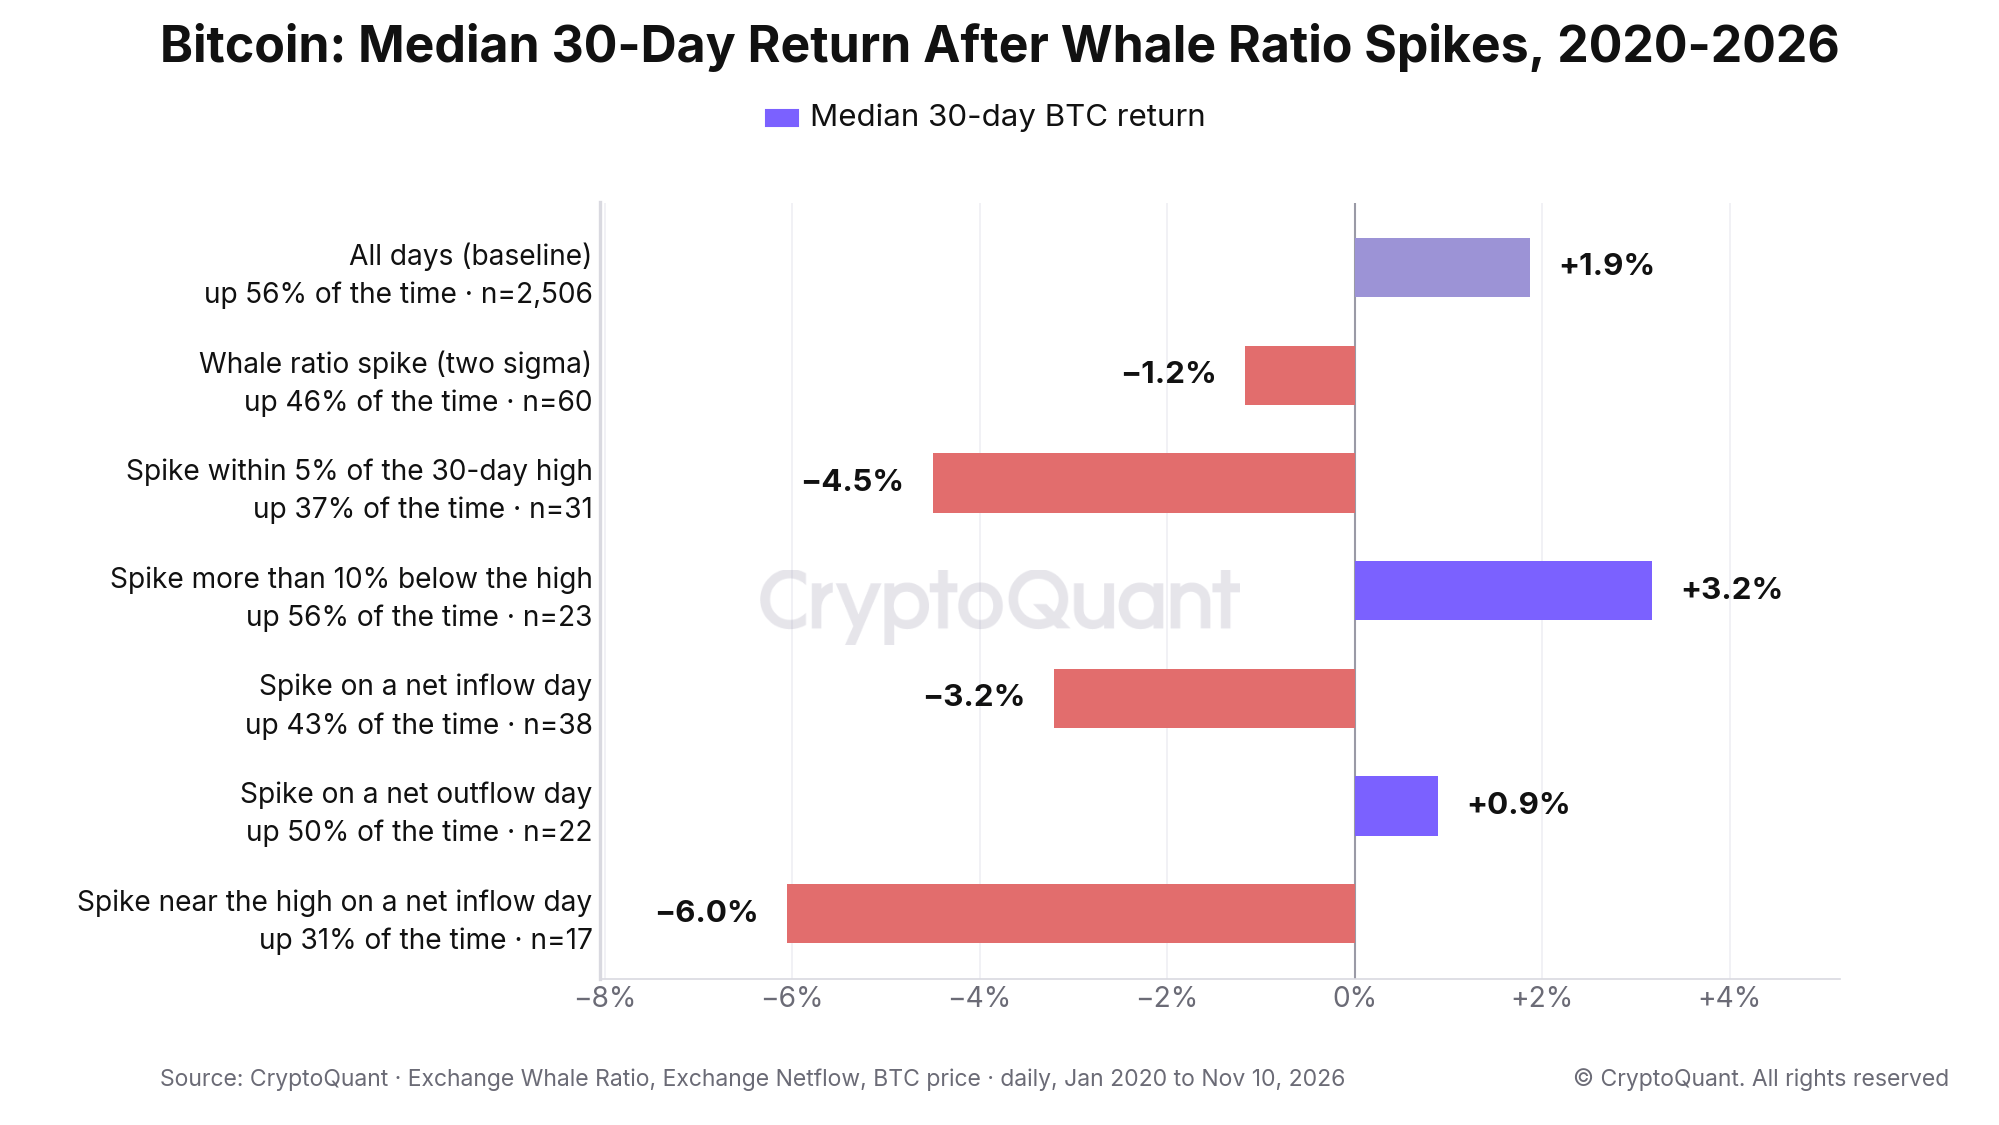
Median 30-day BTC return after whale ratio spikes, January 2020 to November 10, 2026: −4.5% for spikes within 5% of the 30-day high and +3.2% for spikes more than 10% below it, against +1.9% for all days. Source: CryptoQuant.
How to read a whale ratio spike
1. Compare the ratio with its own past year, then check the level
The spike line moves. Since 2020 it has ranged from 0.278 on February 14, 2024 to 0.526 on June 18, 2020. A fixed level misses that. The 146 days above 0.35 returned a median −0.3% over 30 days and −0.4% over 90, because 0.35 was ordinary in some years and rare in others. Level still matters among the spikes. The 48 spikes that were also above 0.35 returned a median −2.4% over 30 days. The 12 at or below 0.35 returned +3.6%, which is too few events to lean on.
On July 16, 2024, the ratio closed at 0.78 against a spike line of 0.33. The ten largest deposits carried 100,505 BTC out of 129,014 BTC. BTC was at $65,058, 2.2% below its 30-day high. By August 5, 2024 it was at $54,019, a decline of 17.0%.
2. Check where price is against its 30-day high
Of the 31 spikes within 5% of the 30-day high, 37% were followed by a higher price after 30 days. On March 22, 2022, the ratio hit 0.61 with BTC at $42,379, 4.6% below the high. On March 31 it hit 0.70 with BTC at $45,525. BTC was 17.3% lower 30 days after March 31 and 55.9% lower after 90 days. On May 15, 2026, the ratio hit 0.39 against a line of 0.34 with BTC at $79,065, 3.8% below the high. BTC fell 16.9% in 30 days and reached $58,535 on June 30, 2026.
Spikes after a fall read differently. On November 22, 2025, the ratio hit 0.35 with BTC 26.0% below its 30-day high. BTC was 4.5% higher 30 days later. It was 19.8% lower after 90 days.
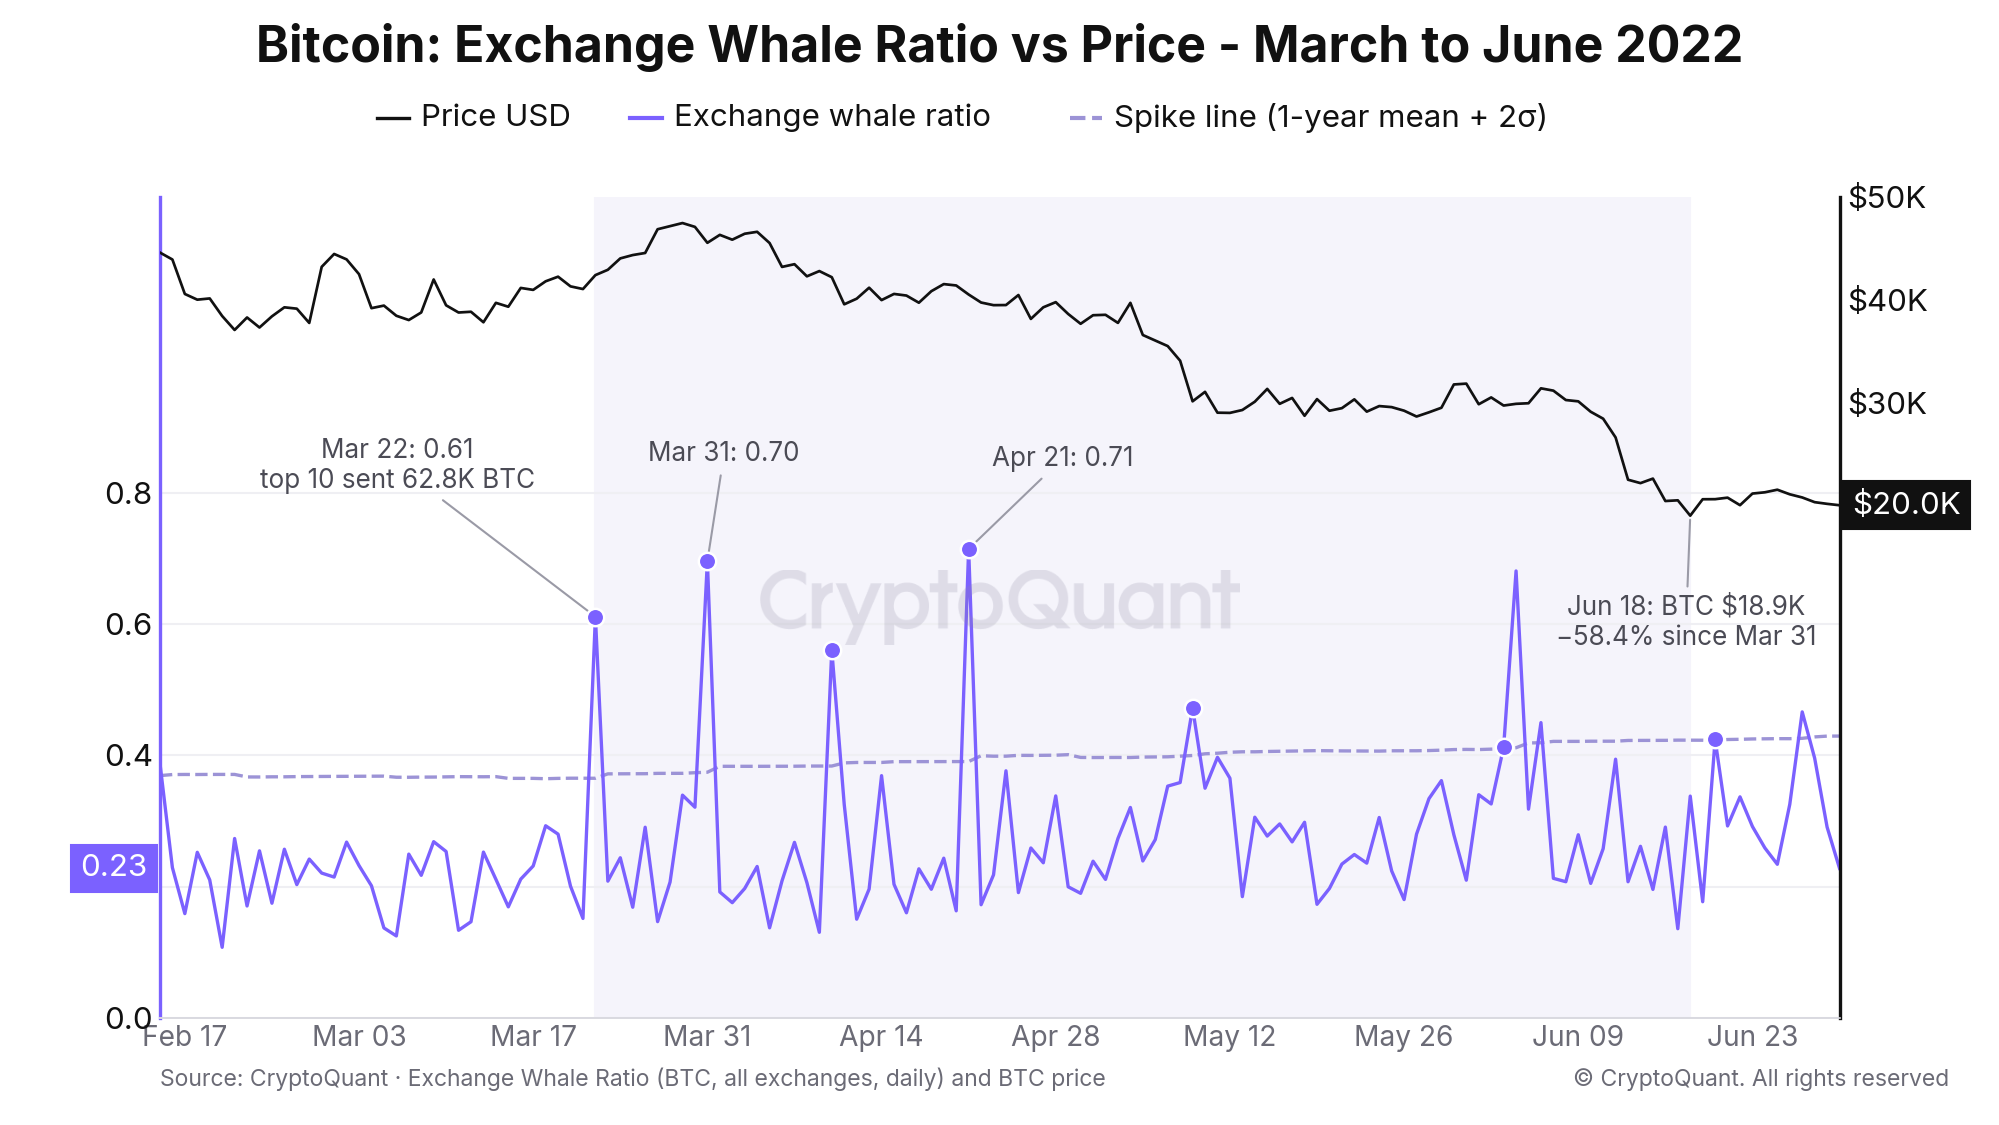
February to June 2022: the whale ratio spiked to 0.61 on March 22, 0.70 on March 31 and 0.71 on April 21 with BTC above $40,000. BTC was at $18,946 on June 18, 58.4% below its March 31 close. Source: CryptoQuant.
3. Check whether the coins stayed on exchanges
A large deposit matters more when it is not offset by withdrawals. Spikes on days with positive exchange netflow returned a median −3.2% over 30 days. Spikes on net outflow days returned +0.9%. Near the high and on a net inflow day, the median was −6.0% and 31% of the 17 cases closed higher.
On November 4, 2022, the ratio hit 0.59 with BTC at its 30-day high of $21,149. The ten largest deposits carried 96,668 BTC and net inflow was 103,486 BTC. BTC was 19.4% lower seven days later. The exchange reserve chart shows over the following days whether those coins stayed, and our guide on how to read Bitcoin exchange reserve covers that reading.
4. Use the 30-day average for the regime
Single days are noisy, so the 30-day average of the ratio is the steadier read. In its lowest quartile since 2020, below 0.179, BTC returned a median +6.5% over 30 days and +25.8% over 90. In the highest quartile, above 0.230, it returned −0.7% and −5.5%. These are overlapping daily observations, so they describe regimes rather than independent events.
When the whale ratio misleads
Large deposits that were not followed by selling. On May 24 and May 25, 2020, the ratio closed at 0.72 and 0.77. On May 25 the ten largest deposits carried 142,940 BTC out of 186,036 BTC. Both were net outflow days. BTC rose 33.9% over the 90 days after May 24, from $8,714 to $11,671. On April 7, 2020, the ratio hit 0.67 and BTC was 38.9% higher 30 days later. The ratio records that large deposits arrived. It does not record what happened to them.
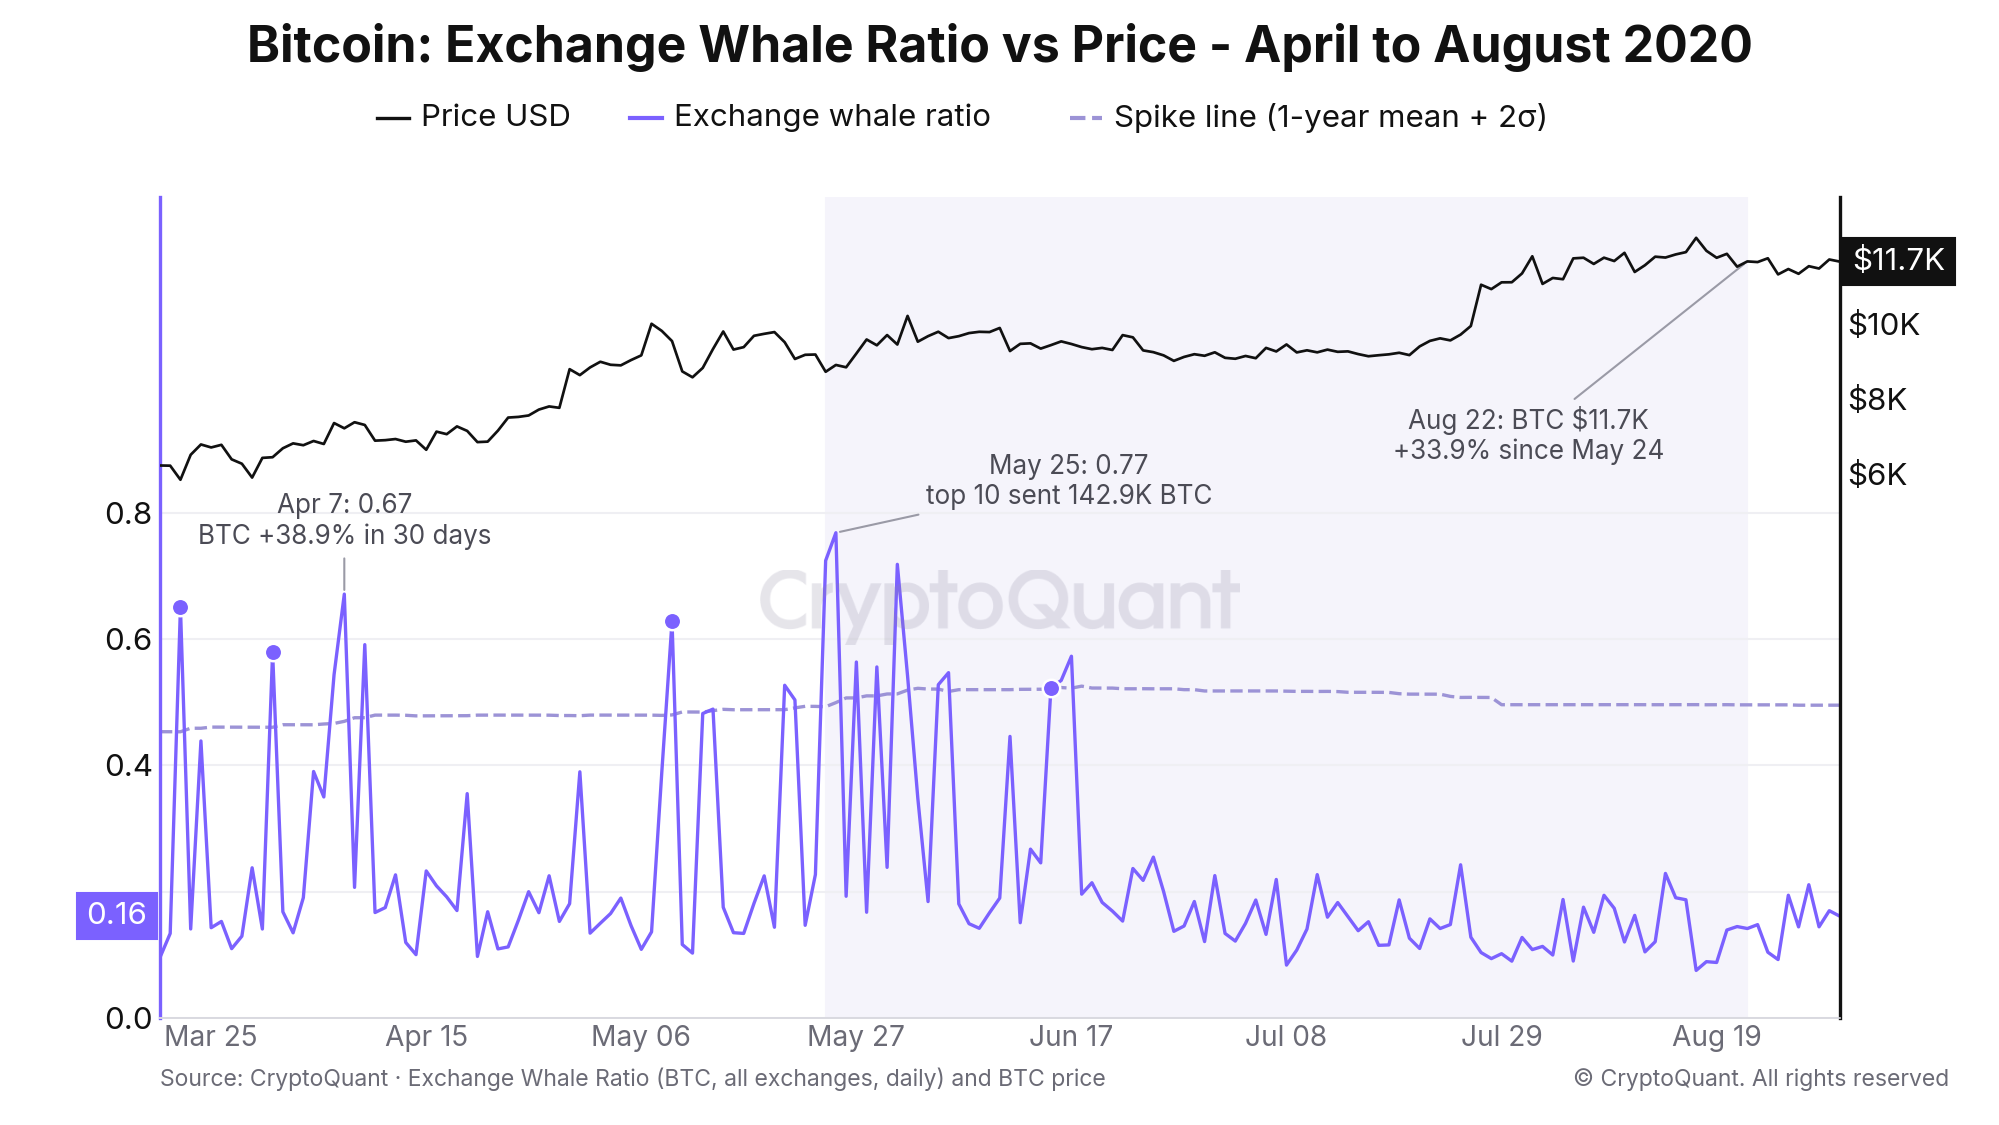
April to August 2020: the whale ratio closed at 0.67 on April 7 and 0.77 on May 25, when the ten largest deposits carried 142,940 BTC. BTC rose 33.9% between May 24 and August 22. Source: CryptoQuant.
Spikes in a strong trend. On July 17, 2021, the ratio hit 0.64 on a net inflow of 45,231 BTC. BTC was at $31,544 and rose 45.6% in 30 days. On November 17, 2024, the ratio hit 0.41 with BTC at $89,882, 1.3% below its 30-day high. BTC was at $106,129 thirty days later, a gain of 18.1%.
Thin days. The ratio is a share, not a size. On Sunday, September 8, 2024, it closed at 0.56 on a total inflow of 14,196 BTC, and the ten largest deposits carried 8,012 BTC. BTC rose 13.2% in 30 days. Since 2020, weekend inflow has averaged 22,899 BTC a day against 48,532 BTC on weekdays, and 17 of the 60 spikes fell on a weekend.
A five-step checklist
1.
Open the exchange whale ratio chart on all exchanges and compare the reading with its past year. A single venue reads higher. On spot exchanges alone the ratio was above 0.35 on 45% of days since 2020.
2.
Check the size in BTC on the exchange inflow chart. A high ratio on a small inflow is a thin day.
3.
Check where price is against its 30-day high.
4.
Check the same day's netflow, then the reserve over the next few days.
5.
Look for confirmation elsewhere. Exchange inflow CDD shows whether the deposited coins were old, and the Coinbase premium index shows whether US spot demand is absorbing them. Our funding rates and open interest playbook covers the leverage side.
What the whale ratio is saying now
As of November 10, 2026, the ratio is 0.29 against a spike line of 0.367. The 30-day average is 0.222, in the third quartile since 2020. There is no spike in force.
The last one was October 20, 2026. The ratio closed at 0.43 against a line of 0.36, and the ten largest deposits carried 18,245 BTC out of 42,534 BTC. Net inflow was 4,877 BTC and BTC was at $82,973, 4.2% below its 30-day high. That is the row with the −6.0% median. BTC was 2.6% lower seven days later and is down 11.2% through November 10, at $73,702.
BTC is now 12.3% below its 30-day high. A spike from here falls in the row with a +3.2% median at 30 days and −9.7% at 90.
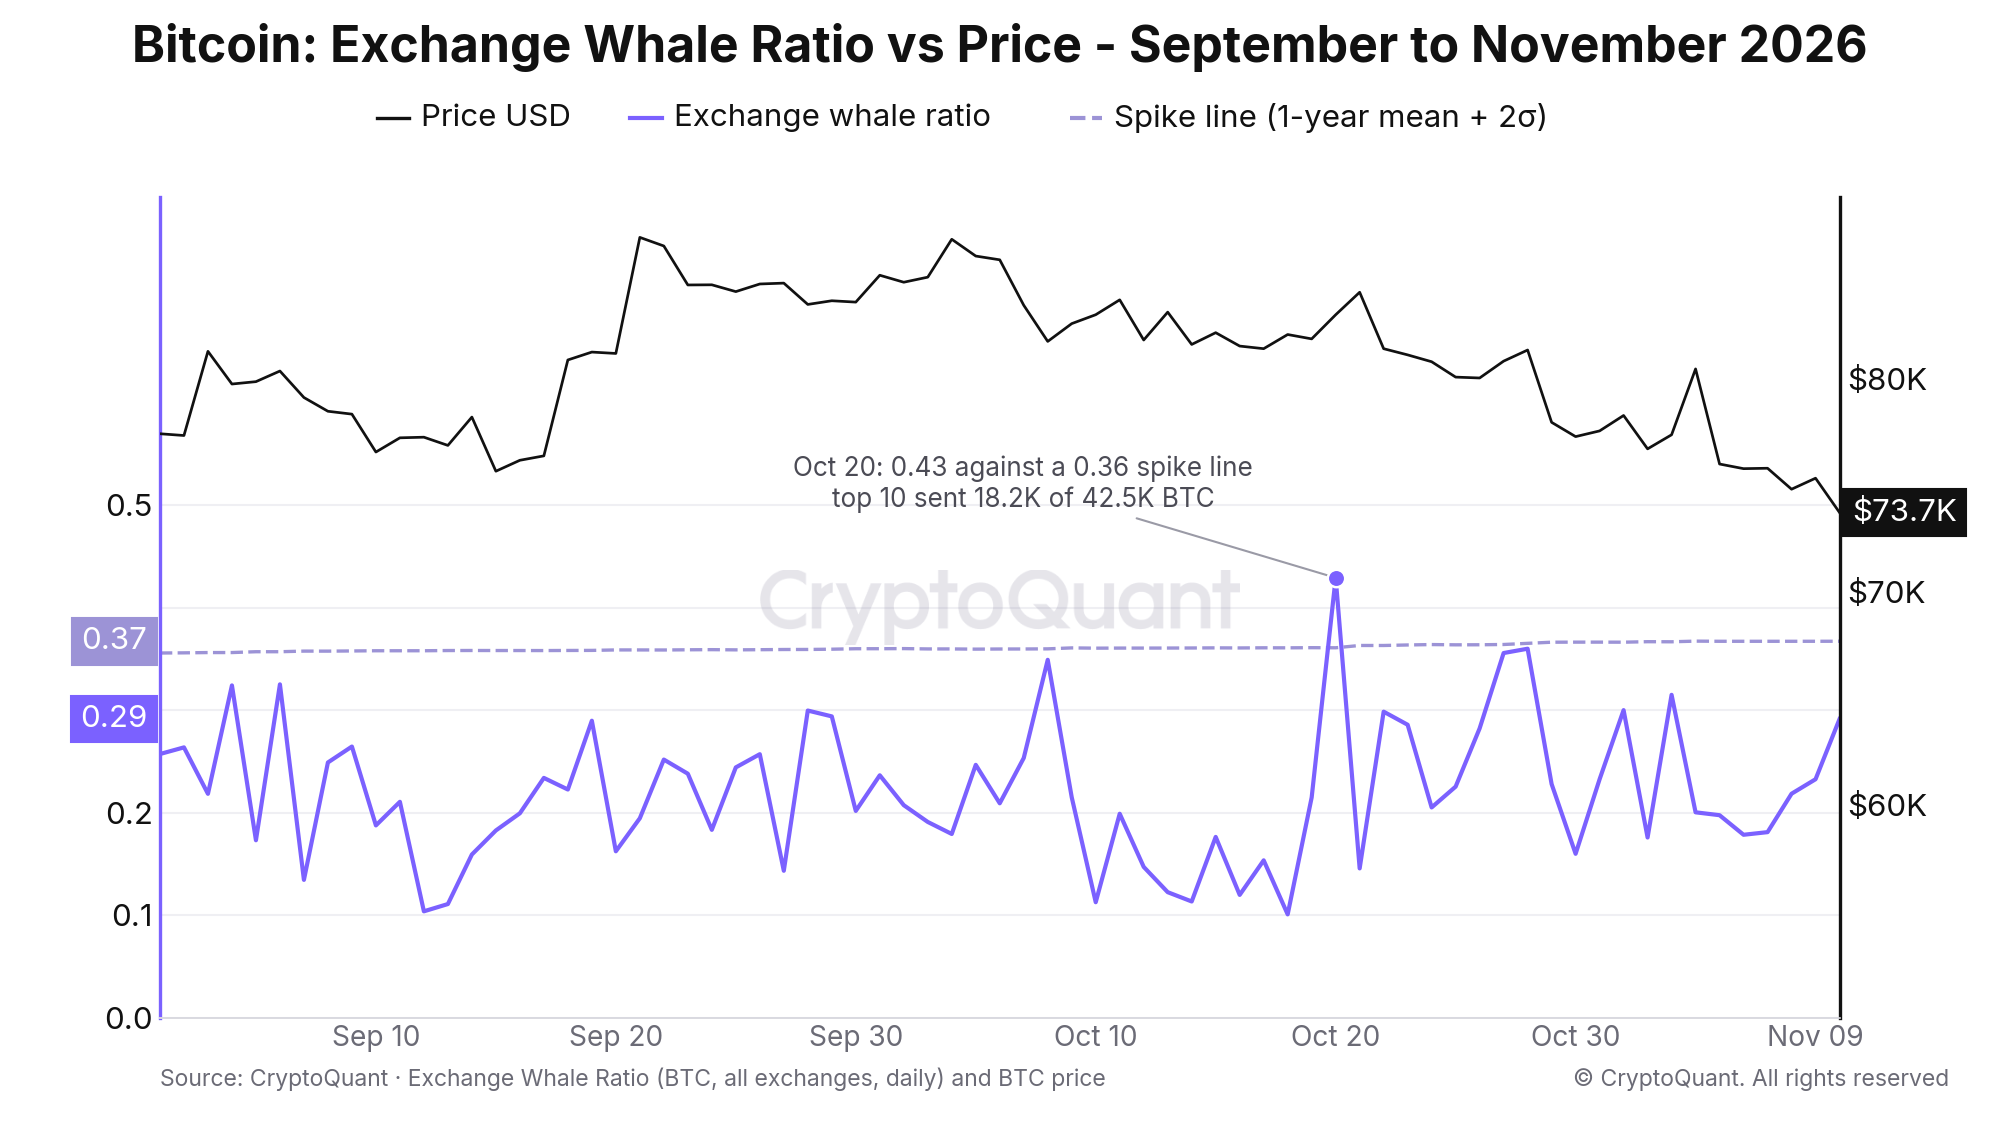
September 1 to November 10, 2026: the whale ratio spiked to 0.43 on October 20 against a spike line of 0.36 and closed at 0.29 on November 10, with BTC down 11.2% since the spike. Source: CryptoQuant.
Track it live
Paired chart: Bitcoin exchange whale ratio chart, with the per-exchange and spot or derivative filters
API: /v1/btc/flow-indicator/exchange-whale-ratio and /v1/btc/exchange-flows/inflow through the CryptoQuant API
MCP: pull the same series into your agent with CryptoQuant MCP
FAQ
What is a high Bitcoin whale ratio?
Since 2020 the all-exchange ratio has had a median of 0.19 and closed above 0.35 on 5.8% of days. A reading more than two standard deviations above its one-year mean counts as a spike, so the line moves with the past year. The exchange whale ratio chart shows the ratio against its history.
Is a high whale ratio bearish?
On average, mildly. BTC returned a median −1.2% in the 30 days after a spike against +1.9% for all days. The result was −4.5% for spikes within 5% of the 30-day high and +3.2% for spikes more than 10% below it.
How is the exchange whale ratio calculated?
It is the sum of the ten largest inflow transactions to exchanges divided by total exchange inflow for the same period.
What is the difference between the whale ratio and exchange netflow?
Netflow is deposits minus withdrawals in BTC. The whale ratio is the share of deposits that came from the ten largest transactions. Our exchange netflow playbook shows how the two work together.
Why is the whale ratio higher on some exchanges?
Ten deposits are a larger share of a smaller venue's inflow. Since 2020 the median daily ratio was 0.24 on Binance, 0.39 on Coinbase Advanced and 0.76 on Bitfinex, against 0.19 for all exchanges combined. Read the all-exchange series first.