
How to Pull CryptoQuant On-Chain Data Into Your AI Workflows (Python Tutorial)
CQ Insights
The CryptoQuant API returns on-chain and market data as JSON, so you can pull it straight into your models, agents and automations. In about 30 lines of Python you can chart Bitcoin's exchange reserve, compare exchanges, flag unusual flows and hand live data to an AI model. Over the 90 days to November 6, 2026, that first chart shows 58,564 BTC leaving exchanges.
What you need
A CryptoQuant API key, from your account page. Which endpoints and how much history you can pull depends on your plan.
Python 3.9 or later.
Step 1: Install the packages
bash
pip install requests pandas plotlyStep 2: Chart Bitcoin's exchange reserve
This fetches the last 90 days of Bitcoin exchange reserve, the total BTC held on exchanges, and plots it. Replace YOUR_API_KEY with your key.
python
import requests
import pandas as pd
import plotly.express as px

API_KEY = "YOUR_API_KEY"

response = requests.get(
    "https://api.cryptoquant.com/v1/btc/exchange-flows/reserve",
    headers={"Authorization": f"Bearer {API_KEY}"},
    params={"exchange": "all_exchange", "window": "day", "limit": 90},
)
response.raise_for_status()

df = pd.DataFrame(response.json()["result"]["data"])
df["date"] = pd.to_datetime(df["date"])
df = df.sort_values("date")

fig = px.line(
    df,
    x="date",
    y="reserve",
    title="Bitcoin Exchange Reserve (Last 90 Days)",
    labels={"date": "Date", "reserve": "Reserve (BTC)"},
    template="plotly_dark",
)
fig.show()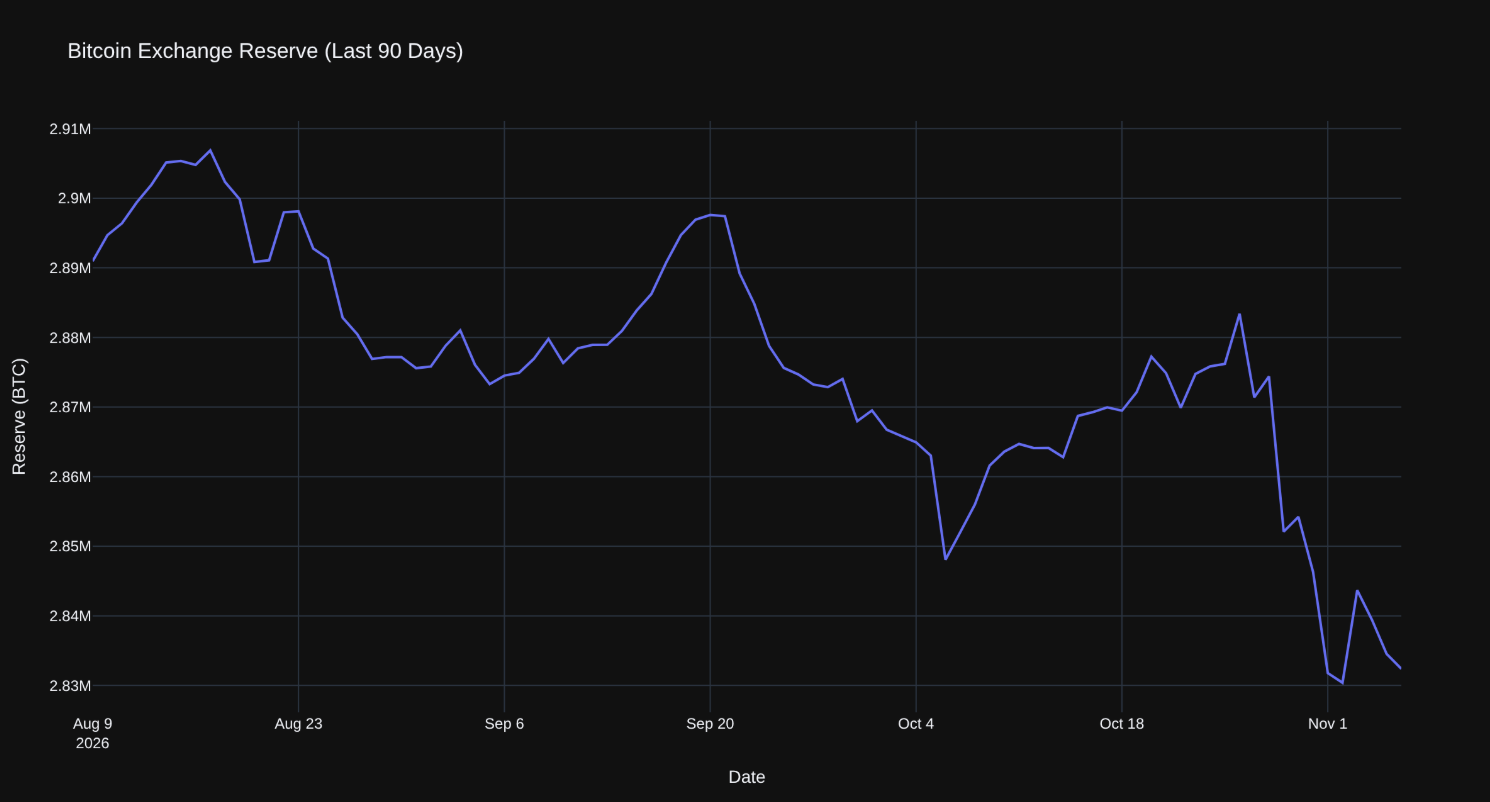
The output of step 2. Bitcoin exchange reserves fell from 2.891 million to 2.832 million BTC between August 9 and November 6, 2026.
The API returns the newest day first, which is why the code sorts by date before plotting. Each row also includes reserve_usd, the same reserve valued in dollars. For how to interpret the line you just drew, including when a falling reserve is misleading, see our exchange reserve playbook.
Step 3: Make it reusable
Once you're pulling more than one metric, wrap the request in a function and keep your key out of the code with an environment variable. Save this as cq.py:
python
import os
import requests
import pandas as pd

API_KEY = os.environ.get("CRYPTOQUANT_API_KEY", "YOUR_API_KEY")
BASE_URL = "https://api.cryptoquant.com/v1"


def get_metric(path, **params):
    """Fetch any CryptoQuant endpoint and return a date-sorted DataFrame."""
    response = requests.get(
        f"{BASE_URL}/{path}",
        headers={"Authorization": f"Bearer {API_KEY}"},
        params={"window": "day", **params},
        timeout=30,
    )
    response.raise_for_status()
    df = pd.DataFrame(response.json()["result"]["data"])
    df["date"] = pd.to_datetime(df["date"])
    return df.sort_values("date").set_index("date")
Then set the key once in your terminal: export CRYPTOQUANT_API_KEY=your_key_here.
Step 4: Compare exchanges
The total can hide what individual venues are doing. Swap all_exchange for specific exchanges and plot the change since the start of the window:
python
import plotly.express as px
from cq import get_metric

exchanges = ["binance", "coinbase_advanced", "okx"]

change = {}
for exchange in exchanges:
    df = get_metric("btc/exchange-flows/reserve", exchange=exchange, limit=90)
    change[exchange] = df["reserve"] - df["reserve"].iloc[0]

fig = px.line(
    change,
    title="Change in BTC Exchange Reserve by Exchange (Last 90 Days)",
    labels={"value": "Change since start (BTC)", "date": "Date", "variable": "Exchange"},
    template="plotly_dark",
)
fig.show()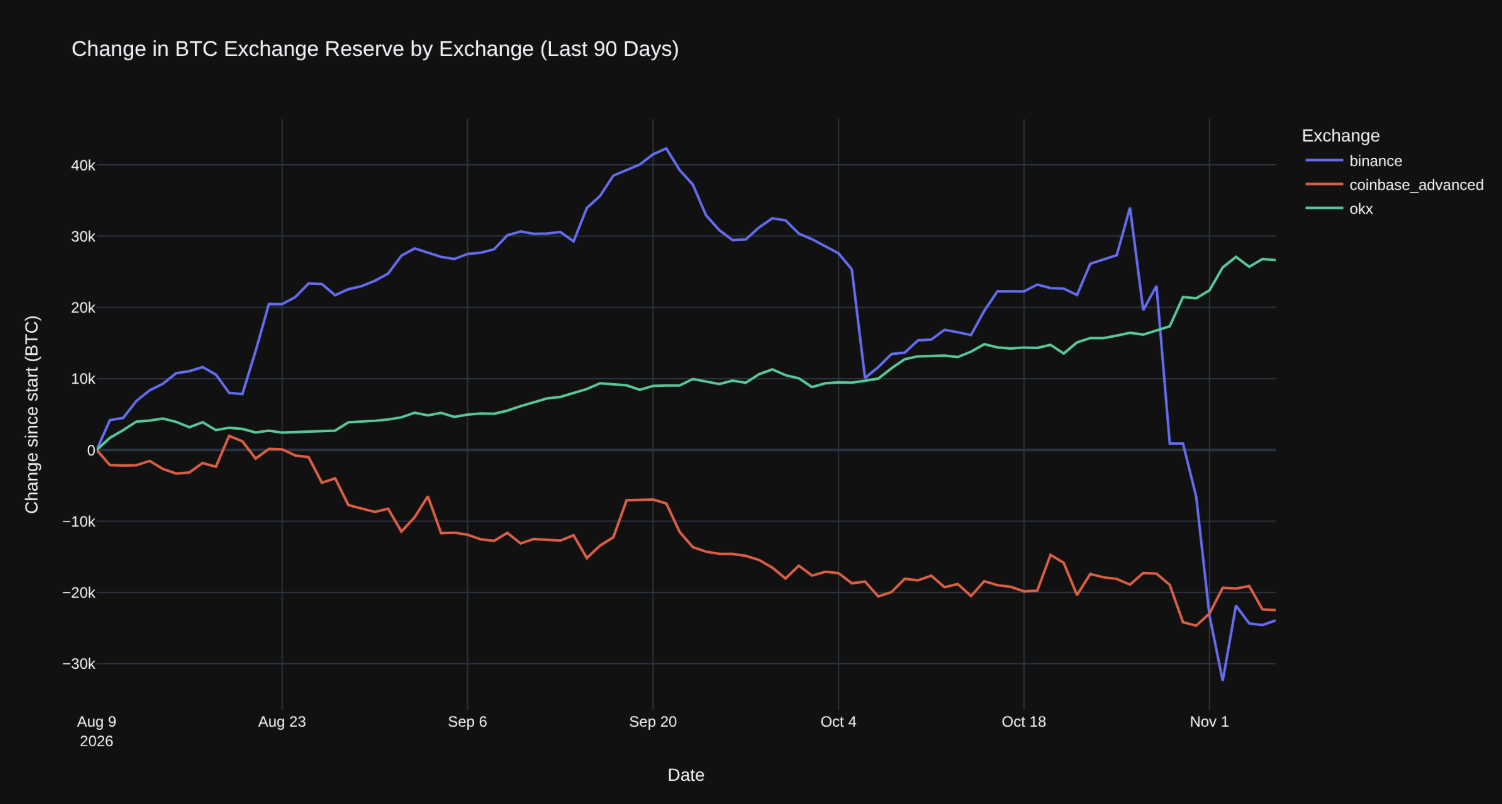
The output of step 4. Over the same 90 days, Binance lost 23,926 BTC and Coinbase lost 22,482 BTC, while OKX gained 26,631 BTC.
That split matters. Almost all of Binance's drop came in the last week of October, which is why our exchange reserve playbook says to check the exchange breakdown before trusting a big market-wide move.
Step 5: Flag unusual flows automatically
Exchange netflow is the daily BTC deposited to exchanges minus BTC withdrawn. This script checks whether today's netflow is a spike: more than two standard deviations from the past year.
python
from cq import get_metric

df = get_metric("btc/exchange-flows/netflow", exchange="all_exchange", limit=365)
netflow = df["netflow_total"]

threshold = 2 * netflow.std()
latest_date = netflow.index[-1].date()
latest = netflow.iloc[-1]

print(f"Spike threshold (2σ, last 365 days): {threshold:,.0f} BTC")
print(f"Latest netflow ({latest_date}): {latest:+,.0f} BTC")

if latest > threshold:
    print("Inflow spike: check whether it reverses over the next 3 days.")
elif latest < -threshold:
    print("Outflow spike.")
else:
    print("No spike.")
On November 6, 2026 it printed:
Spike threshold (2σ, last 365 days): 8,742 BTC
Latest netflow (2026-11-06): -2,133 BTC
No spike.
Run it on a schedule (cron, a GitHub Action or your agent's task runner) and send the result to Slack or Telegram. Not every spike matters, though: our exchange netflow playbook backtests 41 spikes since 2020 and shows which ones did. To add the playbook's "who sent it" filter, pull the exchange whale ratio the same way with get_metric("btc/flow-indicator/exchange-whale-ratio", exchange="all_exchange").
Step 6: Feed the data to an AI model
Language models are good at explaining numbers and bad at remembering current ones. Give the model a compact, dated summary and tell it to use only that:
python
import json
from cq import get_metric

reserve = get_metric("btc/exchange-flows/reserve", exchange="all_exchange", limit=90)["reserve"]
netflow = get_metric("btc/exchange-flows/netflow", exchange="all_exchange", limit=30)["netflow_total"]

context = {
    "as_of": str(reserve.index[-1].date()),
    "exchange_reserve_btc": round(reserve.iloc[-1]),
    "reserve_change_30d_btc": round(reserve.iloc[-1] - reserve.iloc[-31]),
    "reserve_change_90d_btc": round(reserve.iloc[-1] - reserve.iloc[0]),
    "netflow_last_7d_btc": [round(x) for x in netflow.tail(7)],
    "largest_inflow_30d_btc": round(netflow.max()),
    "largest_outflow_30d_btc": round(netflow.min()),
}

prompt = f"""You are a crypto market analyst. Using only the data below,
summarize what Bitcoin exchange flows say about sell-side supply in 3 bullet points.
Cite the numbers you use.

Data (CryptoQuant):
{json.dumps(context, indent=2)}"""

print(prompt)
# Send `prompt` to the LLM or agent framework you already use.
Three habits make the output reliable:
Summarize before you send. A dozen dated numbers work better than 90 rows of raw JSON, and cost fewer tokens.
Date everything. Include as_of so the model never presents old data as current.
Ask for citations. Telling the model to quote the numbers it uses makes hallucinated figures easy to spot.
Skip the code: CryptoQuant MCP
If you work in an AI assistant that supports MCP, the CryptoQuant MCP server gives it direct access to the same data. Instead of writing requests, you ask in plain English, for example "chart Bitcoin's exchange reserve on Binance vs Coinbase for the last 90 days", and the assistant finds the endpoint, pulls the data and analyzes it. Use the API when you need scheduled jobs and production pipelines; use MCP for research and ad-hoc questions.
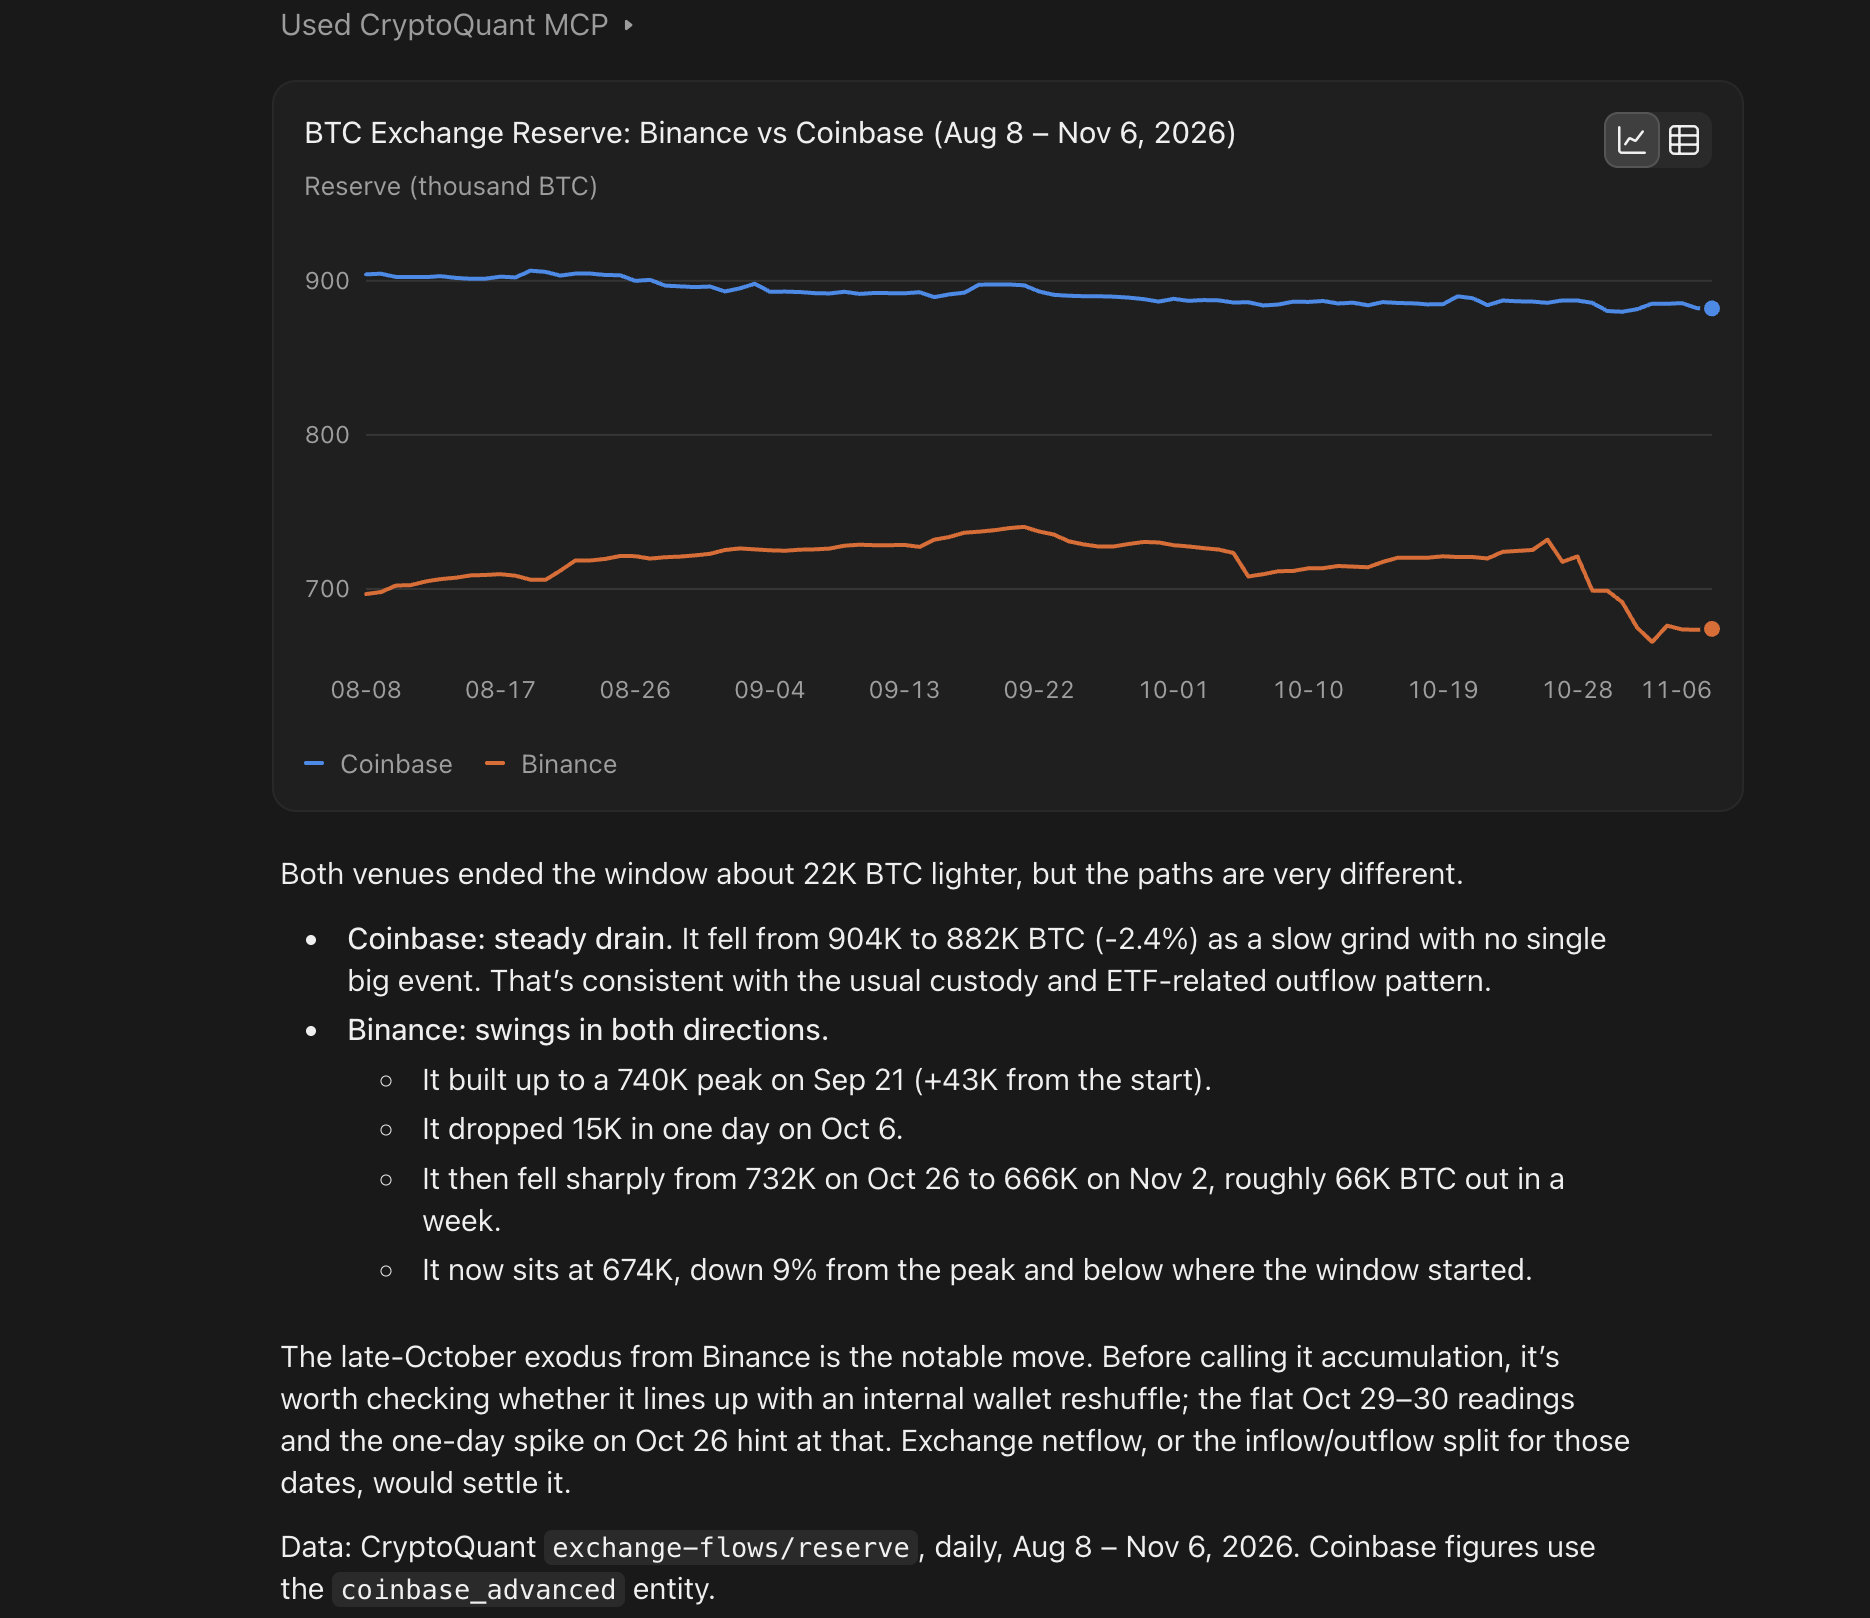
Test run of CryptoQuant MCP using the prompt, "chart Bitcoin's exchange reserve on Binance vs Coinbase for the last 90 days."
Make it your own
Change limit to adjust the time range. The API returns the most recent rows.
Swap all_exchange for a specific exchange such as binance, coinbase_advanced or okx.
Try another endpoint. All of these work with get_metric:
Metric | Path for get_metric | Extra parameters | Chart |
|---|---|---|---|
Exchange reserve | btc/exchange-flows/reserve | exchange | |
Exchange netflow | btc/exchange-flows/netflow | exchange | |
Exchange inflow | btc/exchange-flows/inflow | exchange | |
Exchange whale ratio | btc/flow-indicator/exchange-whale-ratio | exchange | |
Realized price | btc/market-indicator/realized-price | none | |
Coin days destroyed | btc/network-indicator/cdd | none | |
Miner reserve | btc/miner-flows/reserve | miner (e.g. all_miner) | |
BTC price (OHLCV) | btc/market-data/price-ohlcv | market, exchange, symbol |
Track it live
Every metric above has a live chart on CryptoQuant, starting with the Bitcoin exchange reserve chart and the exchange netflow chart, where you can set alerts without writing code. For pipelines, start with the CryptoQuant API; for AI assistants, connect the CryptoQuant MCP.
Which indicator will you build with first? Share your charts and scripts with other builders in the Vibe Quant community on Discord.
FAQ
How do I get a CryptoQuant API key?
Sign in to CryptoQuant and open the API page in your account. Which endpoints you can call and how much history you get depend on your plan.
What format does the CryptoQuant API return?
JSON. The rows are in result.data, newest first, each with a date and one or more value fields, such as reserve and reserve_usd for exchange reserve. Load them into a pandas DataFrame and sort by date, as in step 2.
Can I use CryptoQuant data with AI agents?
Yes, in two ways. Call the API from your agent's code and pass a dated summary to the model (step 6), or connect the CryptoQuant MCP server so the assistant can query the data itself.
What's the difference between the CryptoQuant API and the MCP?
The API is for code: scheduled jobs, backtests and production pipelines. The MCP is for AI assistants: you ask questions in plain English and the assistant pulls the data. Both serve the same underlying data.
Which metrics should I start with?
Exchange flows are the easiest place to start because they're intuitive: coins moving onto exchanges can be sold. Begin with exchange reserve for the trend and exchange netflow for daily events.