
How to Read Bitcoin Exchange Reserve
CryptoQuant.com
Bitcoin exchange reserve is the amount of BTC sitting on exchanges: coins one click away from being sold. Read it as a trend, not a level. Falling reserves set a supportive backdrop. Sudden spikes flag panic. A reserve that rises off a low while price stalls is one of the clearer warnings on-chain data gives. Here's how to read it, using real episodes from 2020 to 2026.
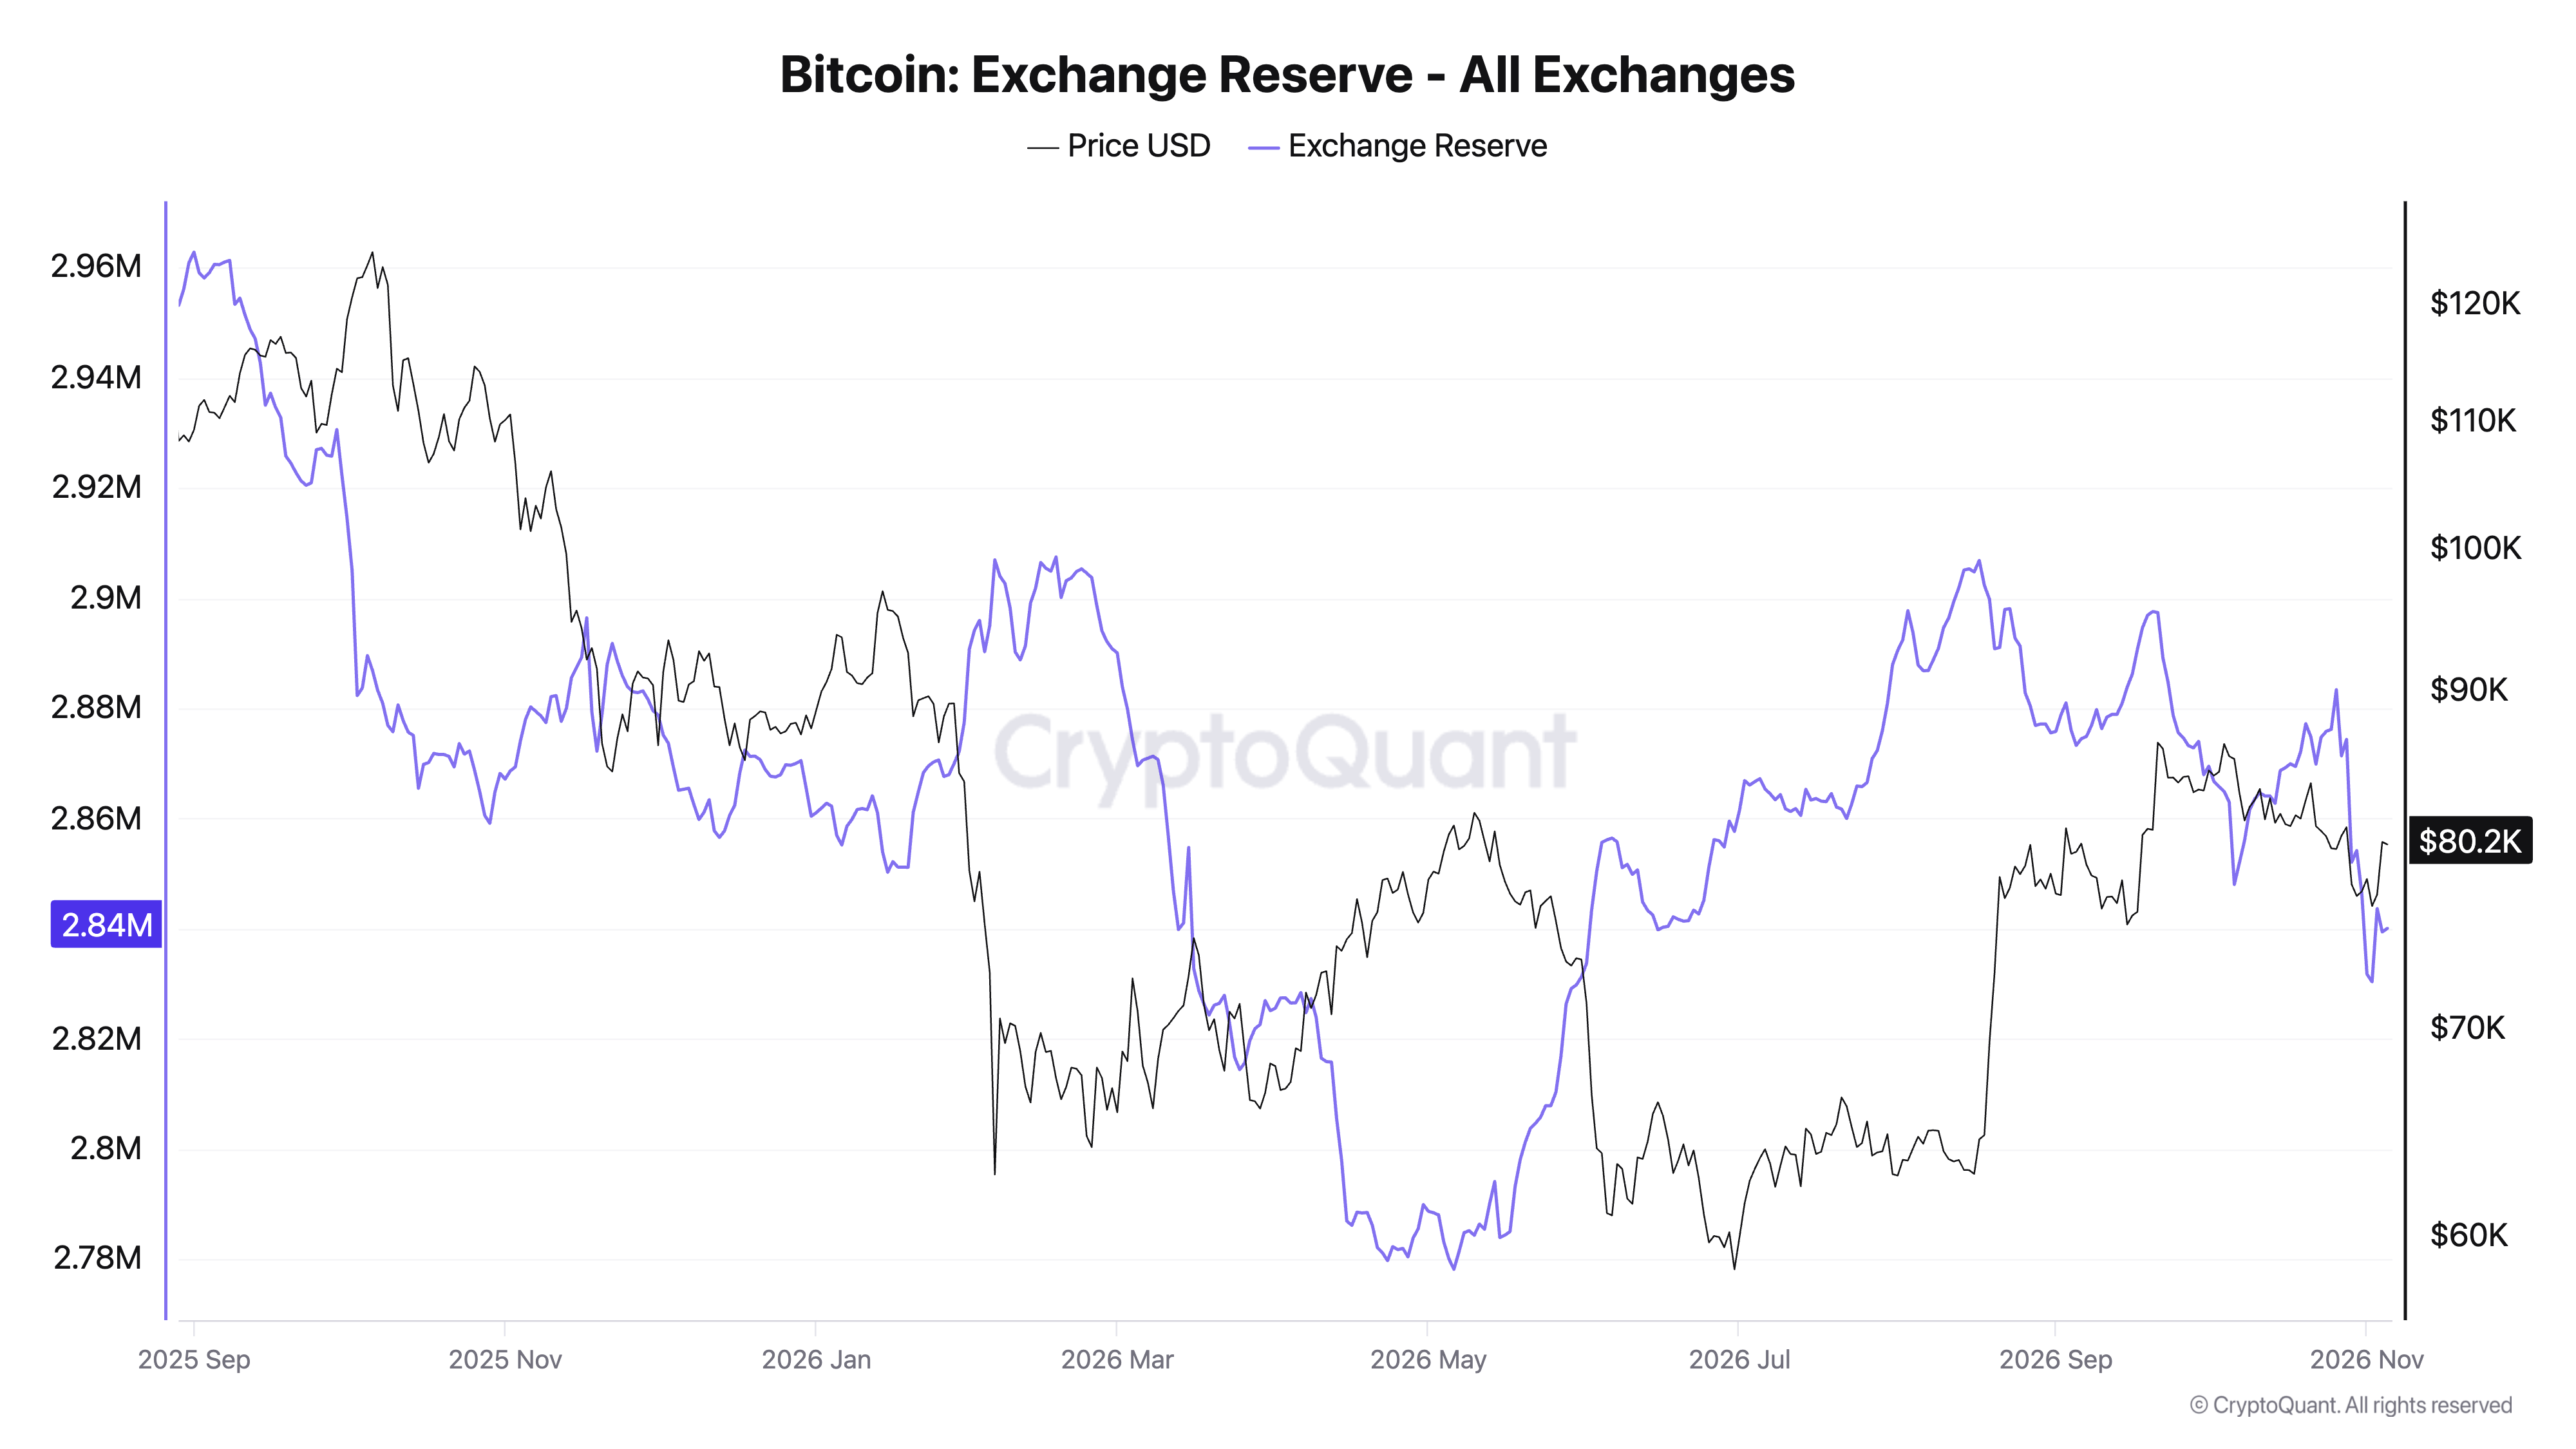
Exchange reserve vs price since September 2025. The May low didn't mark the bottom; the August peak did.
Where Bitcoin exchange reserves stand in 2026
As of November 5, 2026, the Bitcoin exchange reserve chart shows 2.84 million BTC across all tracked exchanges, with BTC near $80,400. That's 66,000 BTC below the August 17 peak of 2.91 million, and 62,000 BTC above the May 6 low of 2.78 million. That May low was below where reserves stood on the eve of the March 2020 crash.
Bitcoin exchange reserve, explained
Exchange reserve is the running total of BTC held in wallets identified as belonging to centralized exchanges. Every deposit adds to it and every withdrawal subtracts, so it's effectively cumulative exchange netflow. It covers both spot and derivatives venues. Coins on derivatives exchanges are often collateral rather than supply waiting to be sold. The full methodology is in the exchange reserve definition.
The logic is simple: coins have to reach an exchange before they can be sold there. More coins on exchanges means more potential sell-side supply. The skill is in telling which moves reflect real behaviour.
Four rules for reading exchange reserve
1. Read the trend over weeks, not the daily level
Daily readings are noisy. Exchanges move coins between hot and cold wallets, and address labels get updated. What matters is the direction over several weeks, and whether price is moving with it or against it. Absolute levels also drift as new exchange addresses are labelled, so compare a level with its own recent history, not with a figure in a three-year-old article.
2. A sharp spike during a sell-off is panic, and often near a low
When holders rush coins onto exchanges at once, the reserve jumps.
March 2020. Reserves rose by 74,000 BTC in two days (March 11–13) as BTC fell from about $7,900 to $4,800. That was the COVID crash low.
February 5, 2026. Reserves jumped about 12,000 BTC in a single day as price dropped 14%, from roughly $73,000 to $62,800. Reserves kept climbing to 2.91 million by February 17. The bear market wasn't over, but the spike marked a local flush.
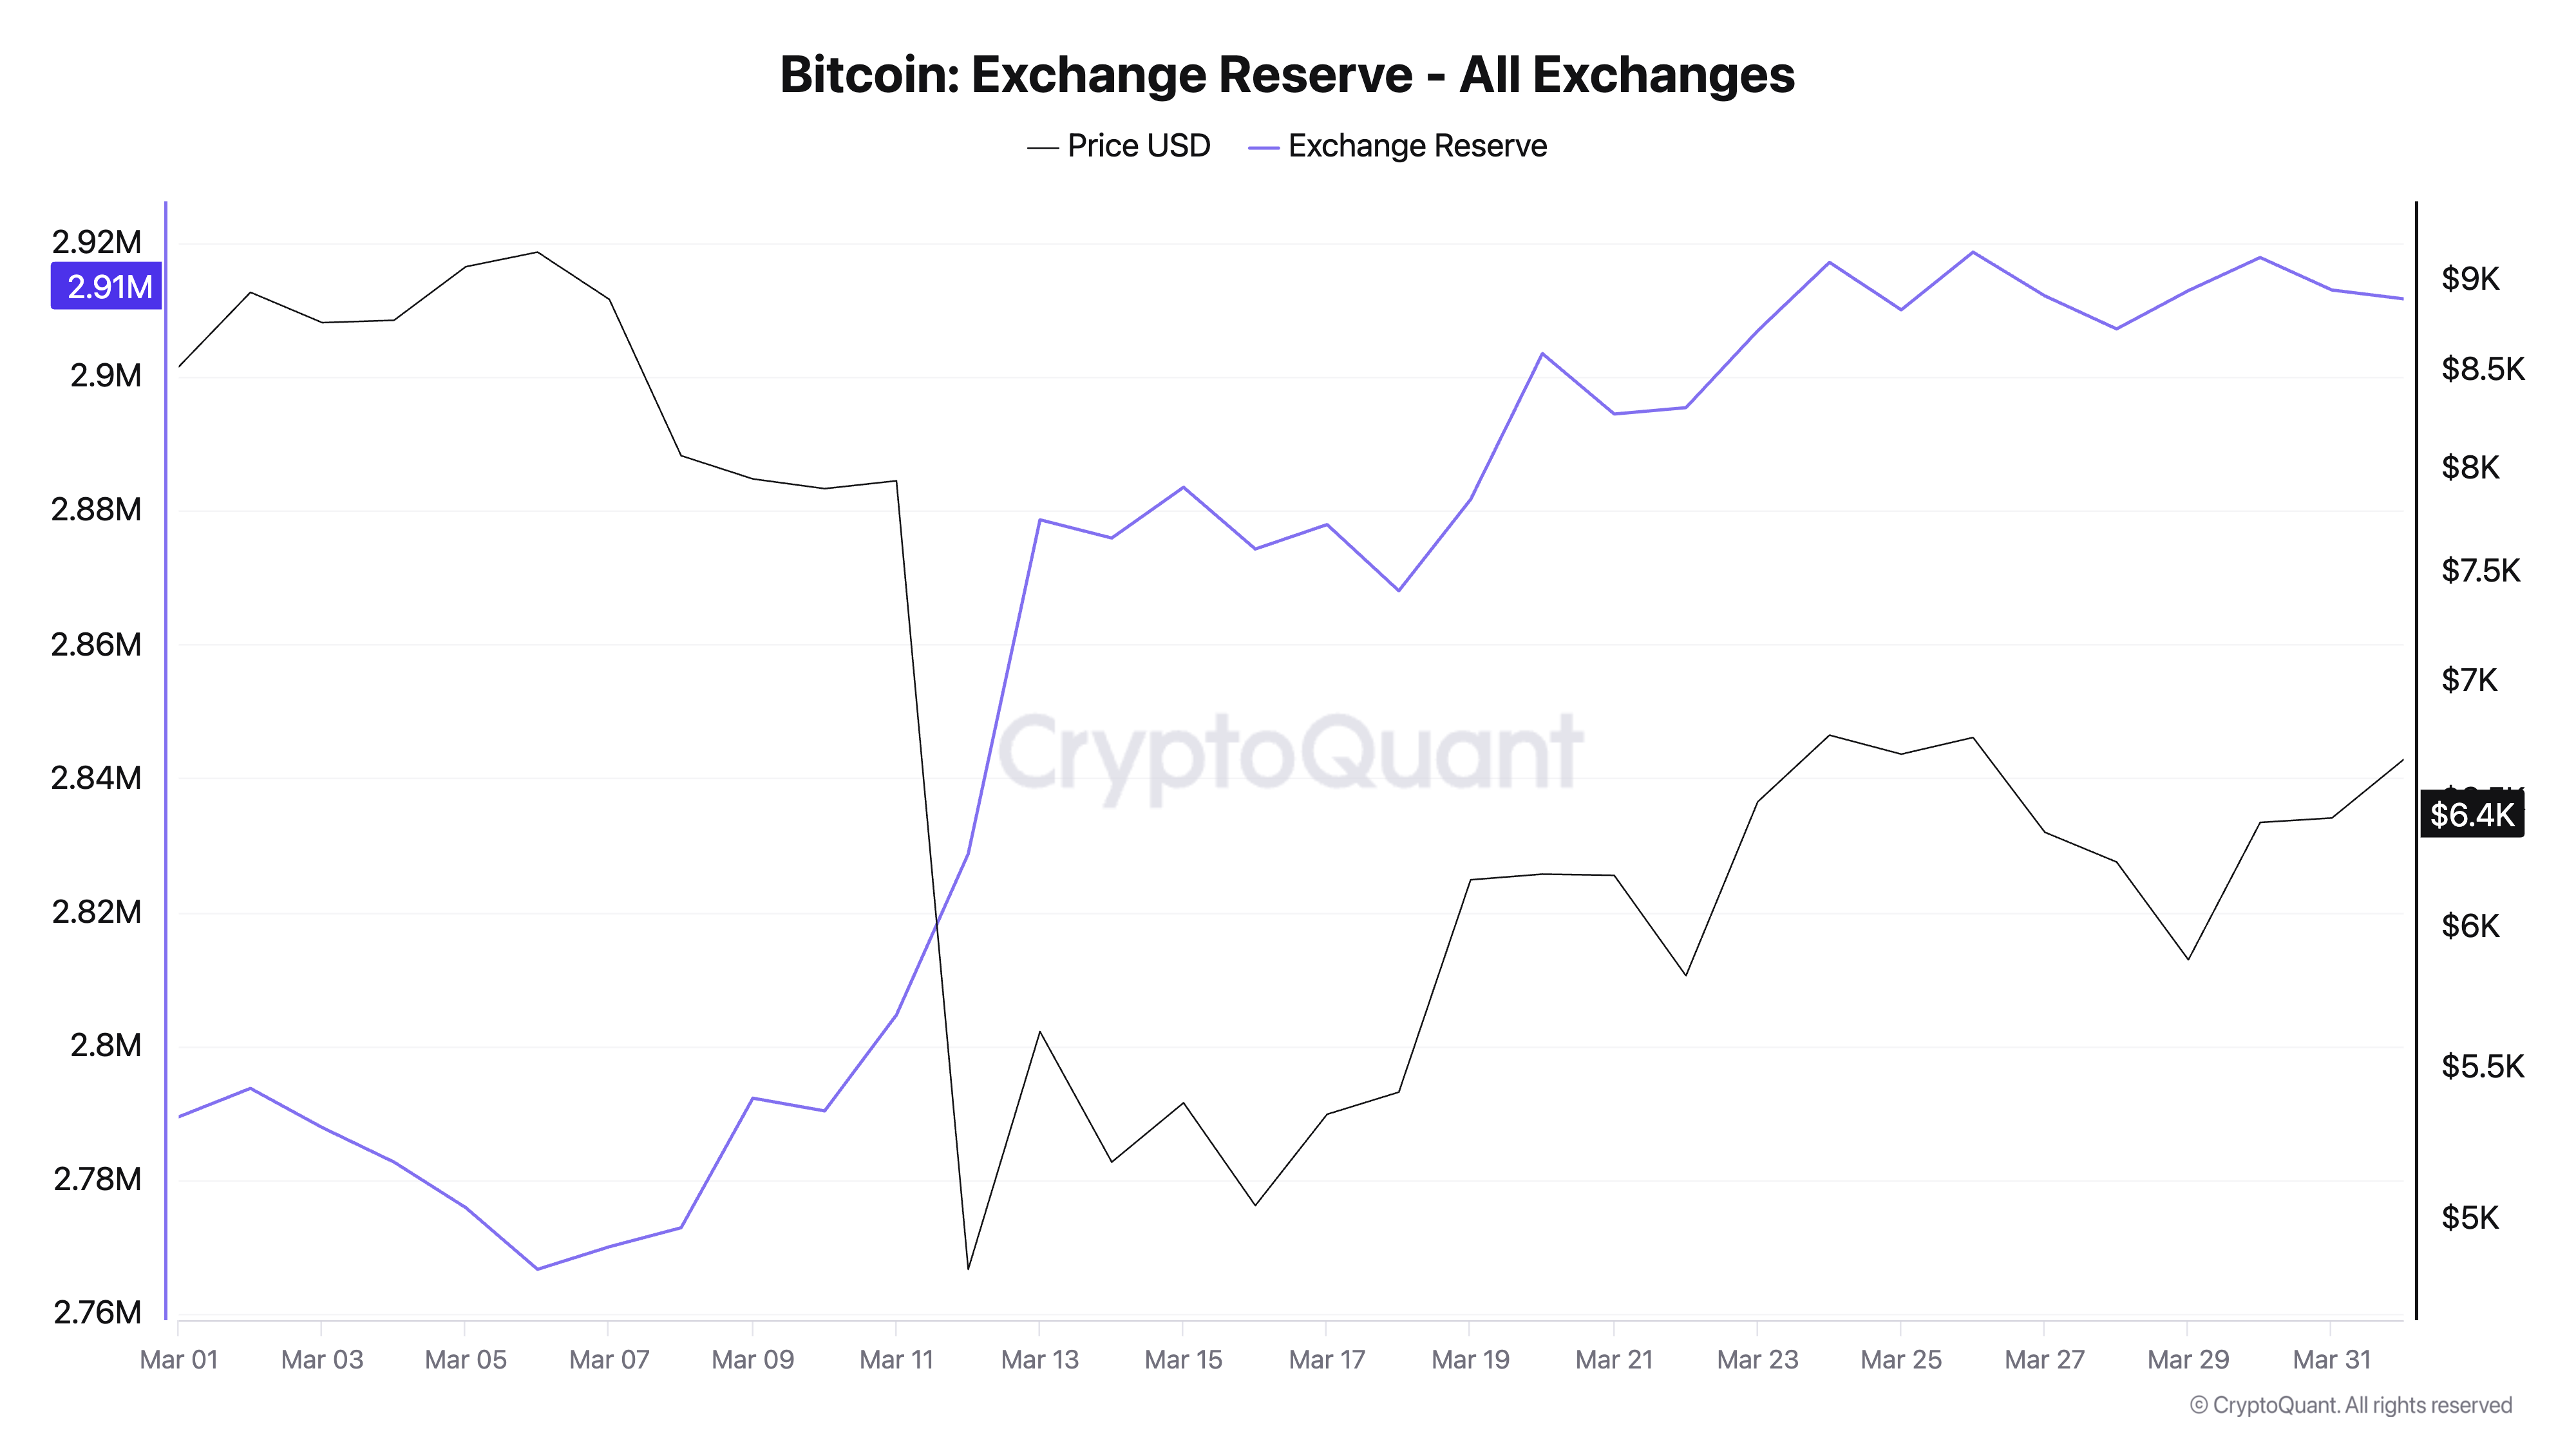
March 2020: panic deposits pushed exchange reserves up 74,000 BTC in two days, right at the crash low.
3. A rising exchange reserve off a low is a warning
This is the signal most guides miss. On May 6, 2026, reserves hit their cycle low of 2.78 million with BTC around $81,400. It looked like a supply squeeze. Instead, reserves climbed by about 80,000 BTC over the next eight weeks, and price fell 28% to $58,600 by June 30, the bear market low.
Coins coming back to exchanges while price stalls means holders are getting ready to sell. A falling reserve only matters while it keeps falling.
4. A falling exchange reserve with rising price confirms a recovery
The mirror image came in August. Reserves peaked at 2.91 million on August 17 with BTC around $64,500. Over the next 11 days, about 30,000 BTC left exchanges while price rose 21%, to $77,800. By September 21, BTC was at $86,600. When coins leave exchanges and price rises at the same time, demand is absorbing supply rather than just pausing selling.
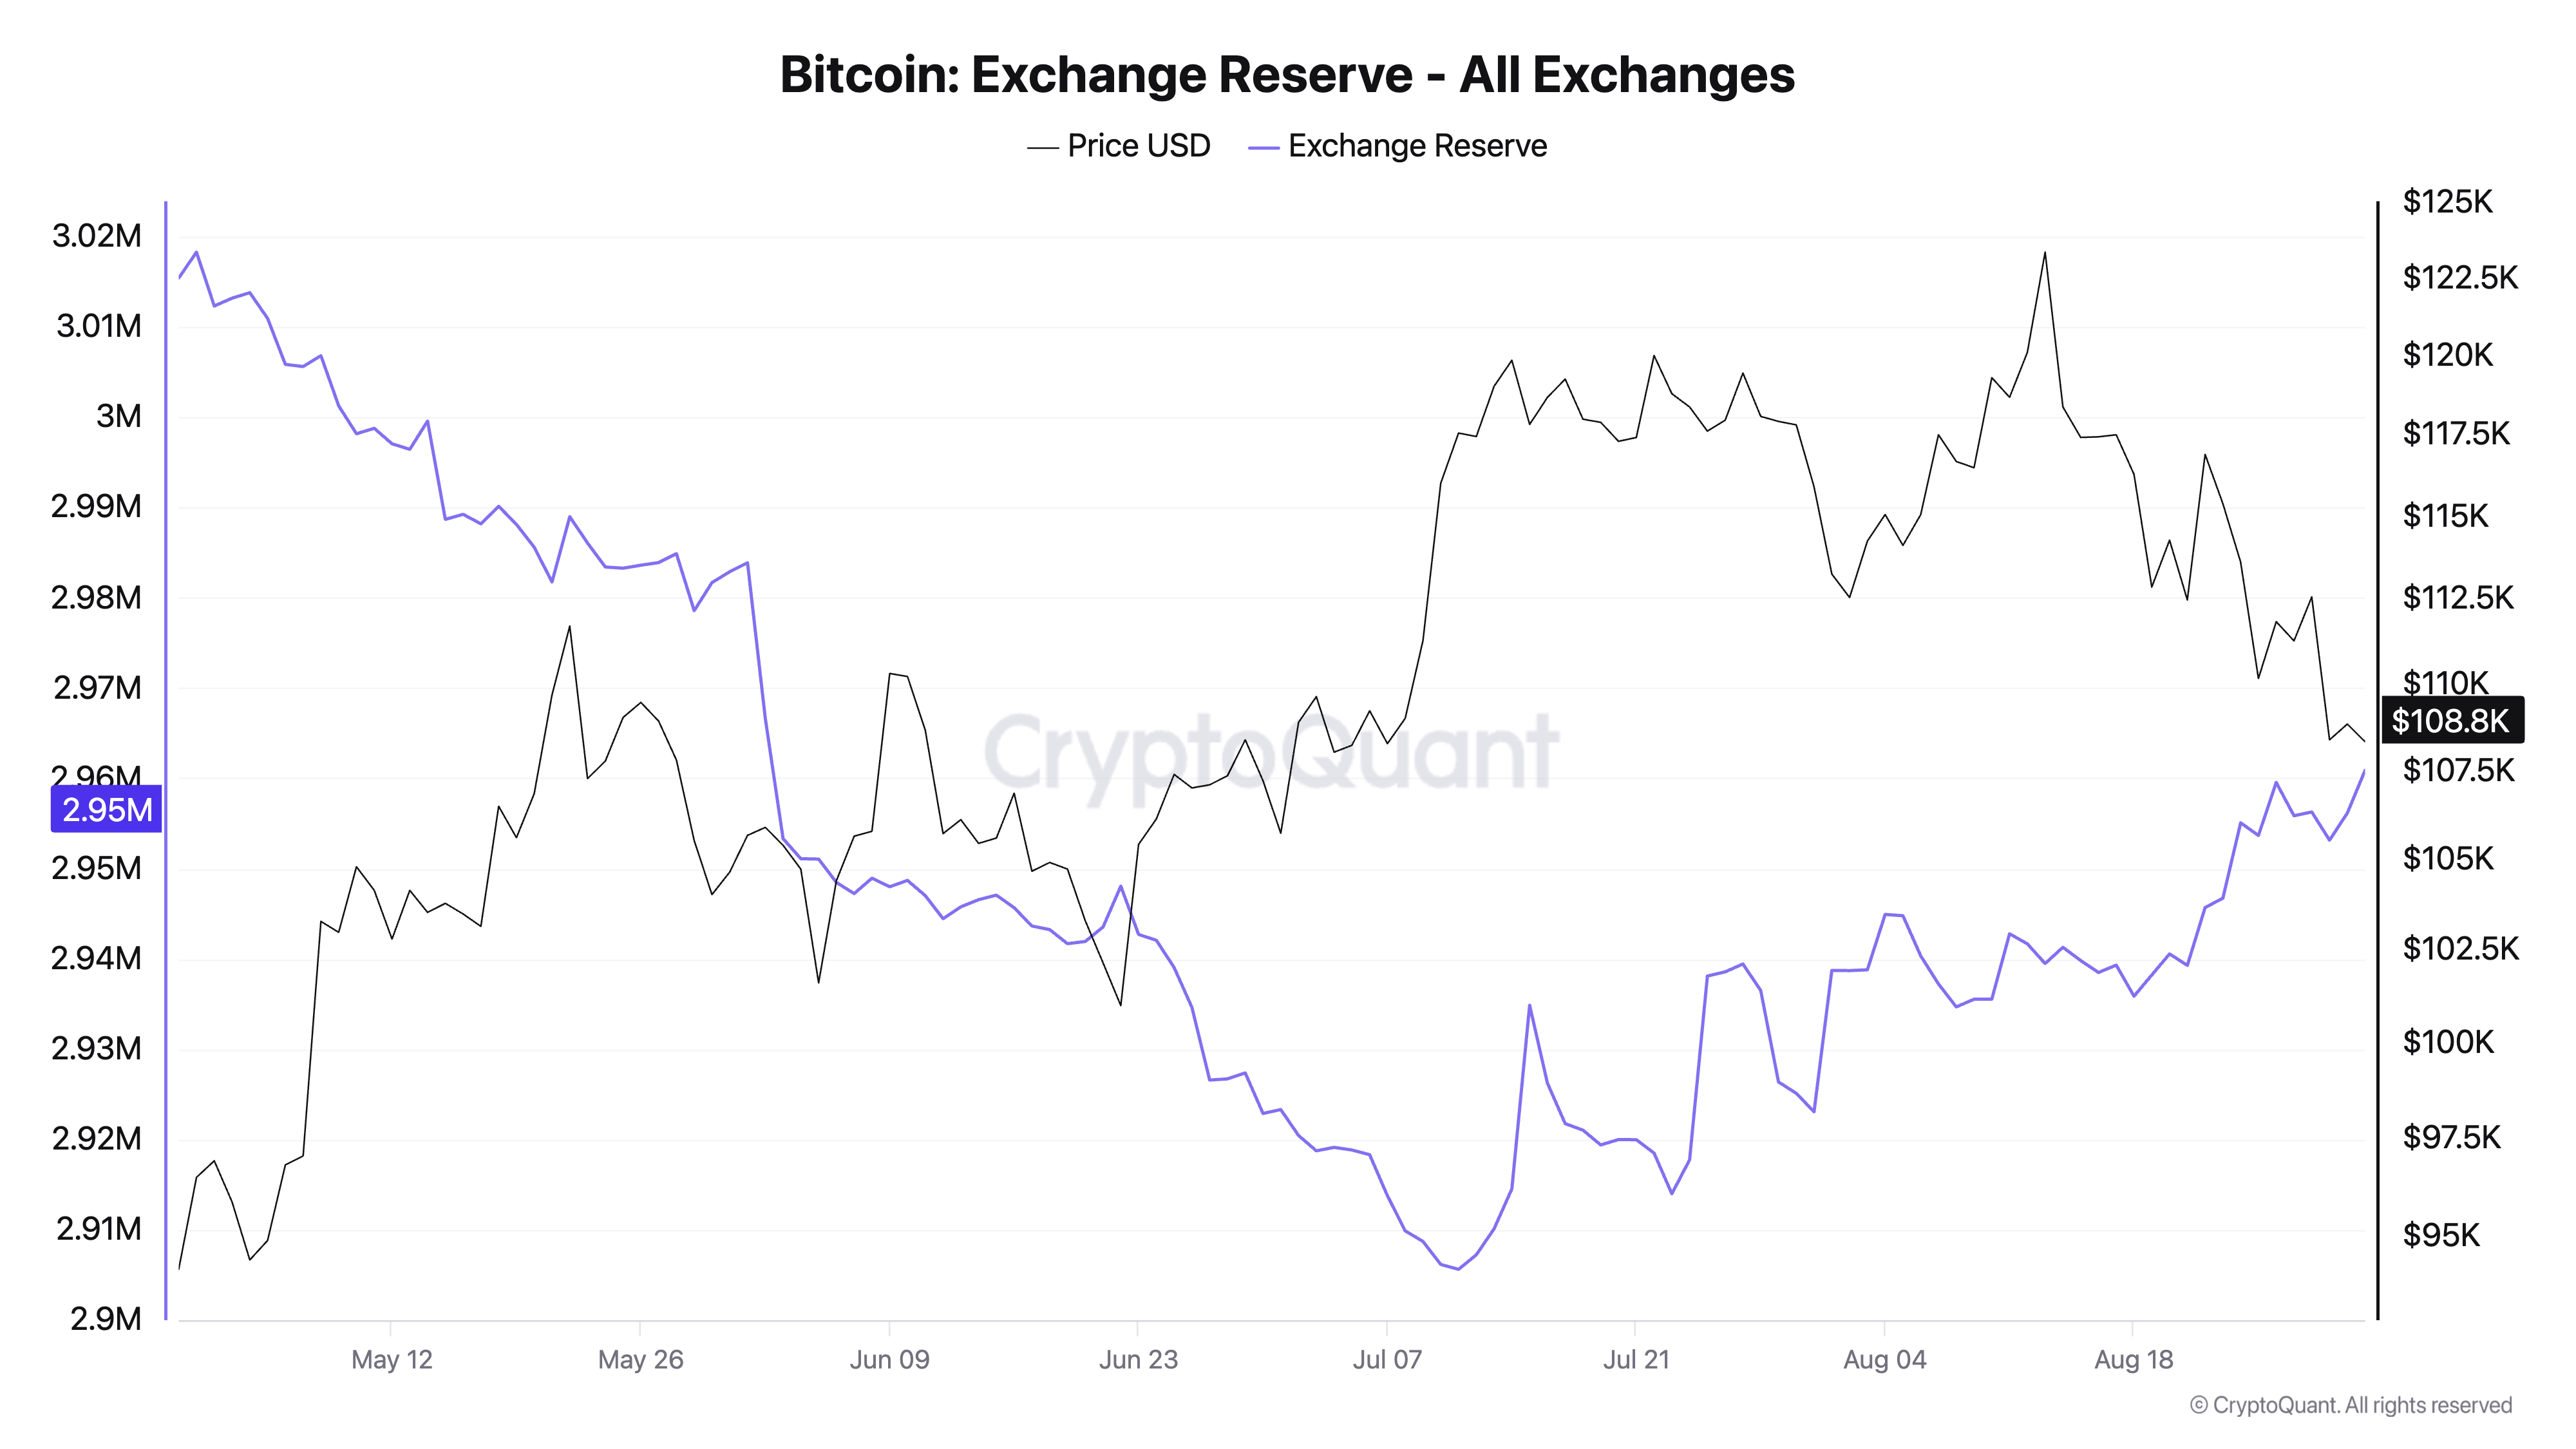
Rising reserves into the June 2026 low (warning), then falling reserves through the August breakout (confirmation).
When a falling exchange reserve isn't bullish
"Falling reserves are bullish" is the most repeated line about this metric. Three cases show where it breaks down.
A falling backdrop doesn't stop a bear market. From September 1, 2025 to May 6, 2026, exchange reserves fell by 185,000 BTC (−6.2%). Over the same period, BTC slid from about $109,000 to $81,400, after peaking near $124,700 in October. Supply leaving exchanges set a floor under the long-term picture. It did nothing to time the top or the bottom.
Withdrawals can be fear, not conviction. During the FTX collapse, reserves fell by 322,000 BTC (−9.3%) in 19 days, between November 6 and 25, 2022. Users weren't accumulating. They were pulling coins from exchanges they no longer trusted. Price fell 25% to $15,800 on November 21. That turned out to be the cycle low, but anyone reading the outflows as buying pressure in real time was early and underwater.
Some coins leave exchanges for custodians. Reserves stood around 3.22 million BTC on the day spot ETFs launched in January 2024. They're 2.84 million today. Part of that decline reflects coins moving to custodians that don't count as exchanges, which is ownership changing location rather than supply disappearing. Check ETF demand alongside reserve outflows to see where the coins went.
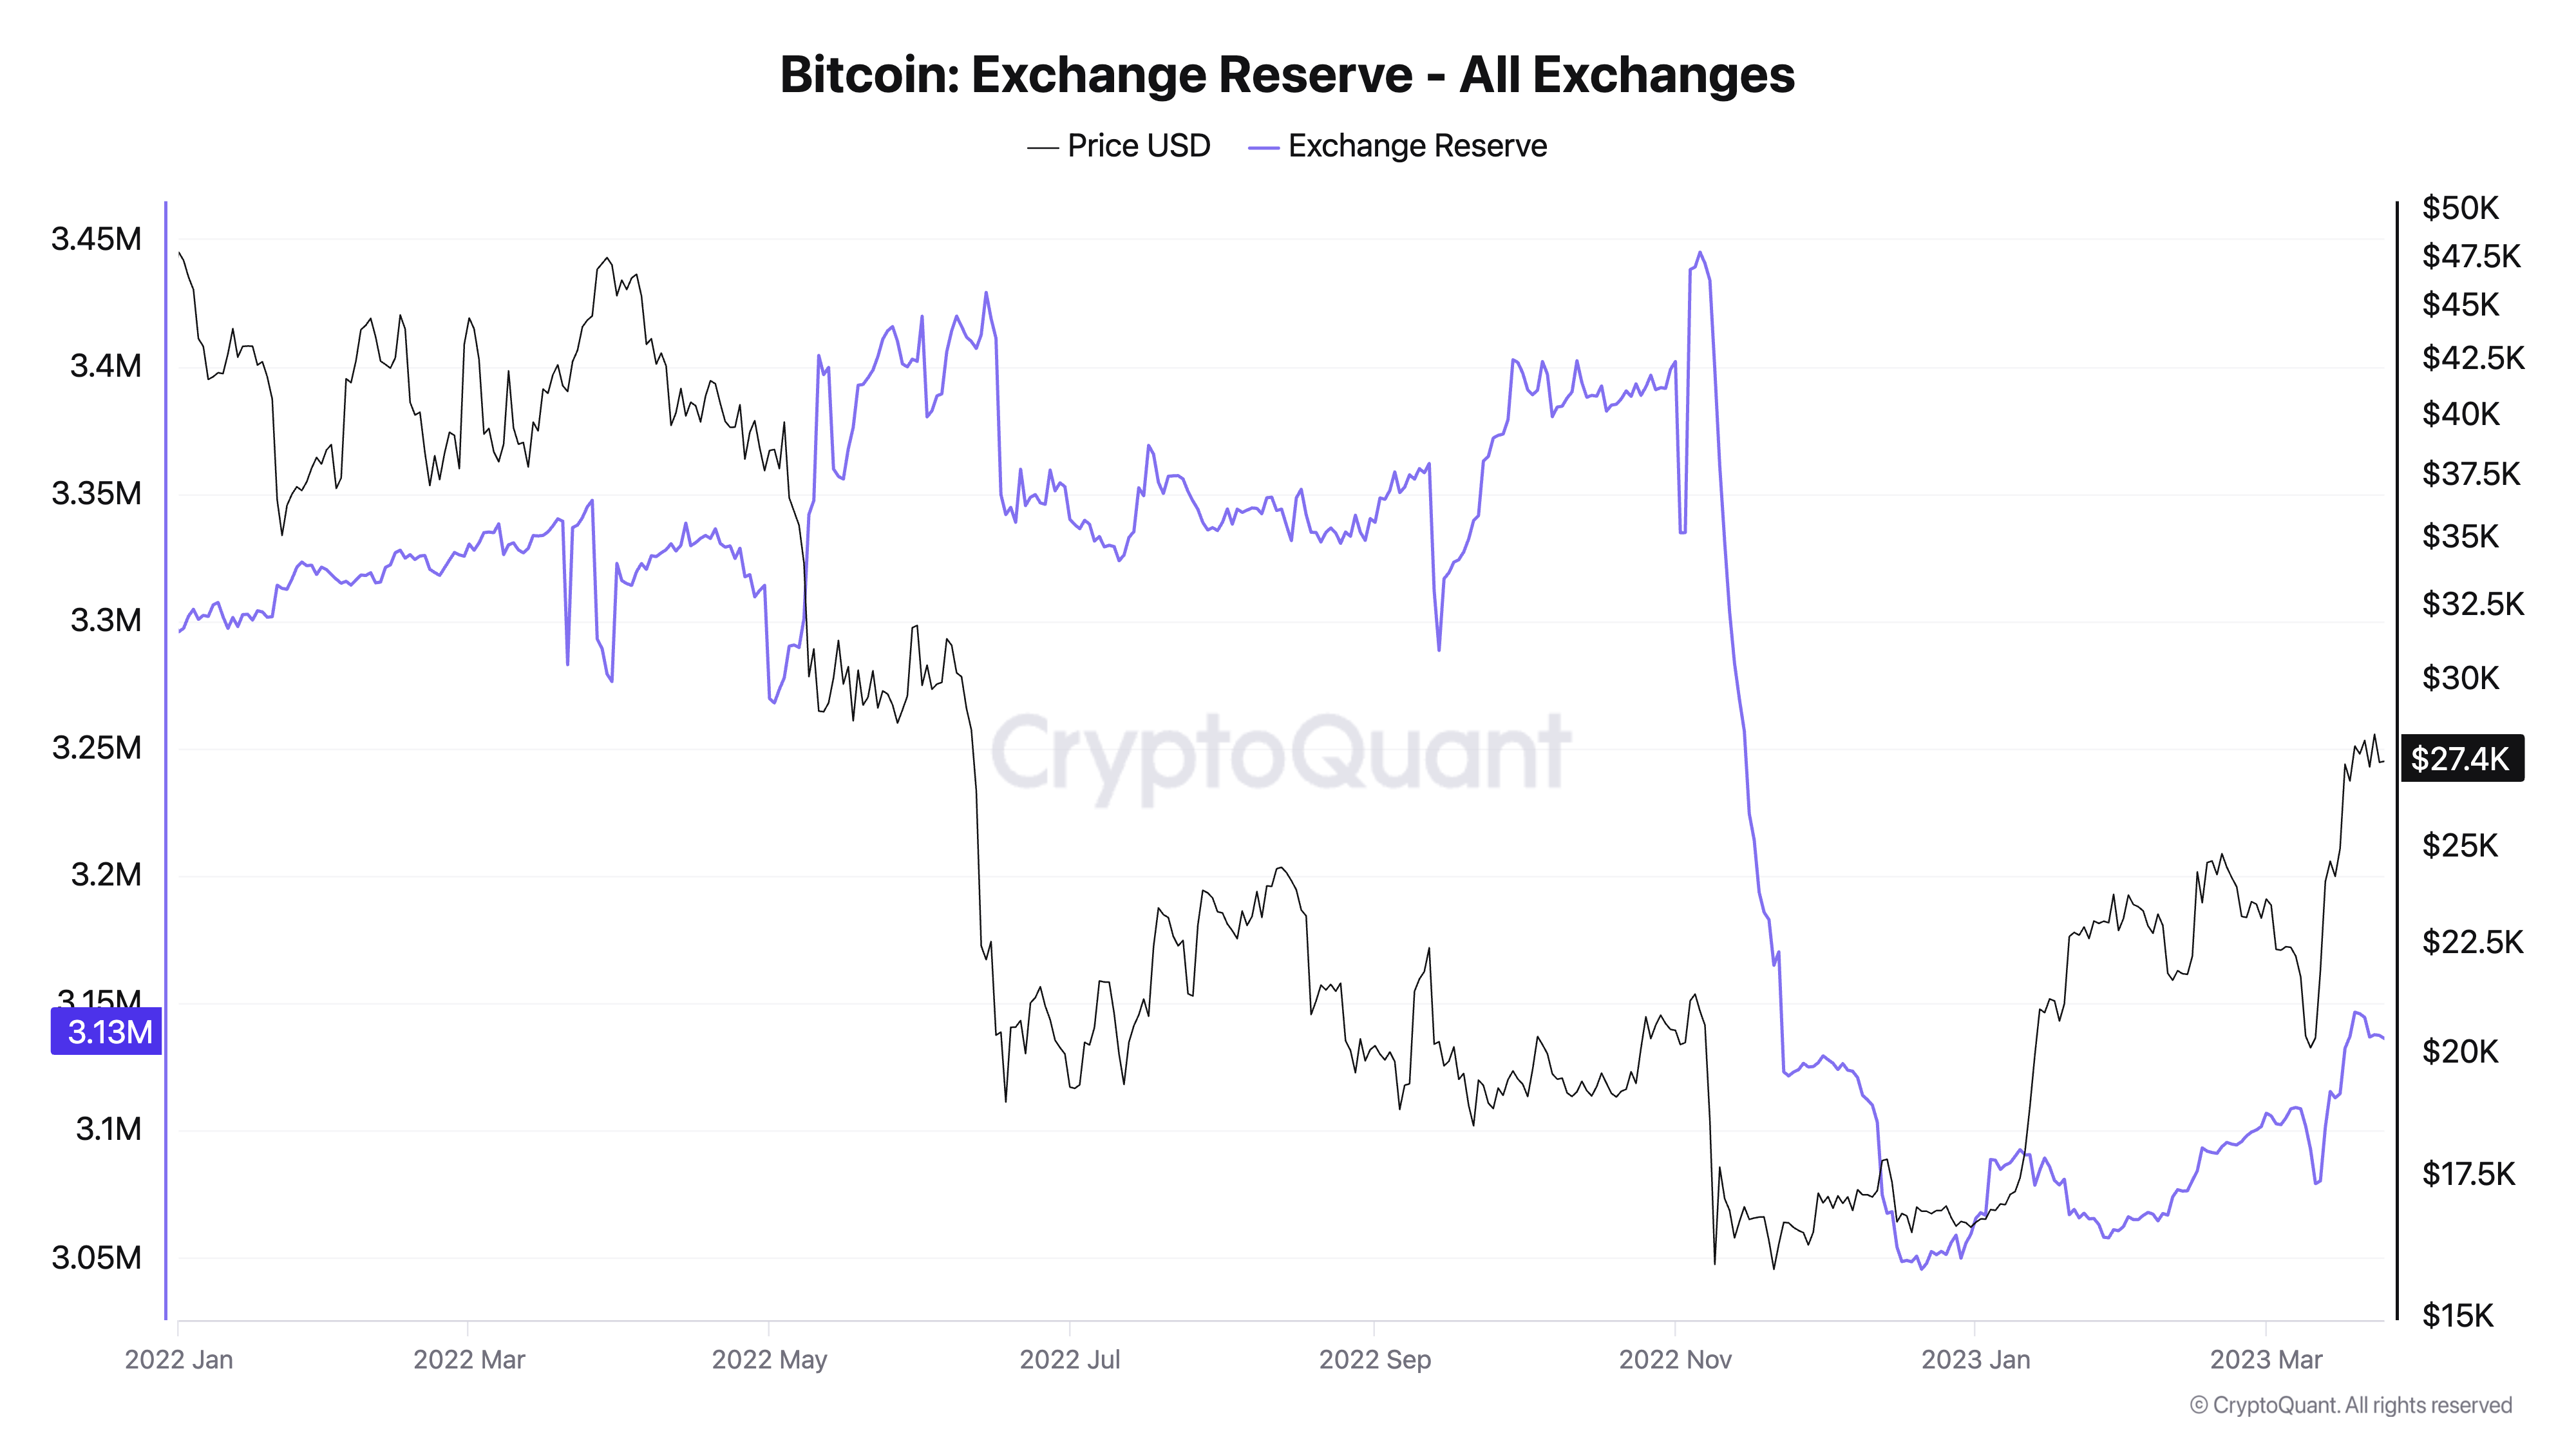
FTX, November 2022: a record exodus from exchanges driven by fear, not accumulation.
Check the exchange breakdown before you trust a big move
Between October 26 and November 2, 2026, total exchange reserves fell by 53,000 BTC. That was the largest seven-day drop in more than a year. It looks like heavy accumulation, until you filter by exchange.
Exchange | Oct 26 | Nov 2 | Change |
|---|---|---|---|
Binance | 732,000 | 665,600 | −66,400 (−9.1%) |
Coinbase Advanced | 885,700 | 885,200 | Flat |
OKX | 157,800 | 167,000 | +9,200 |
Bitfinex | 433,100 | 433,900 | Flat |
All exchanges | 2,883,400 | 2,830,400 | −53,000 |
The entire move came from one venue. A drop concentrated in a single exchange can be real user withdrawals, but it can also be internal wallet restructuring or a custody change. Before reading it as market-wide accumulation, check whether the outflows went to known exchange or custodian wallets, and whether netflow on other venues agrees. Here it didn't: OKX gained coins over the same week.
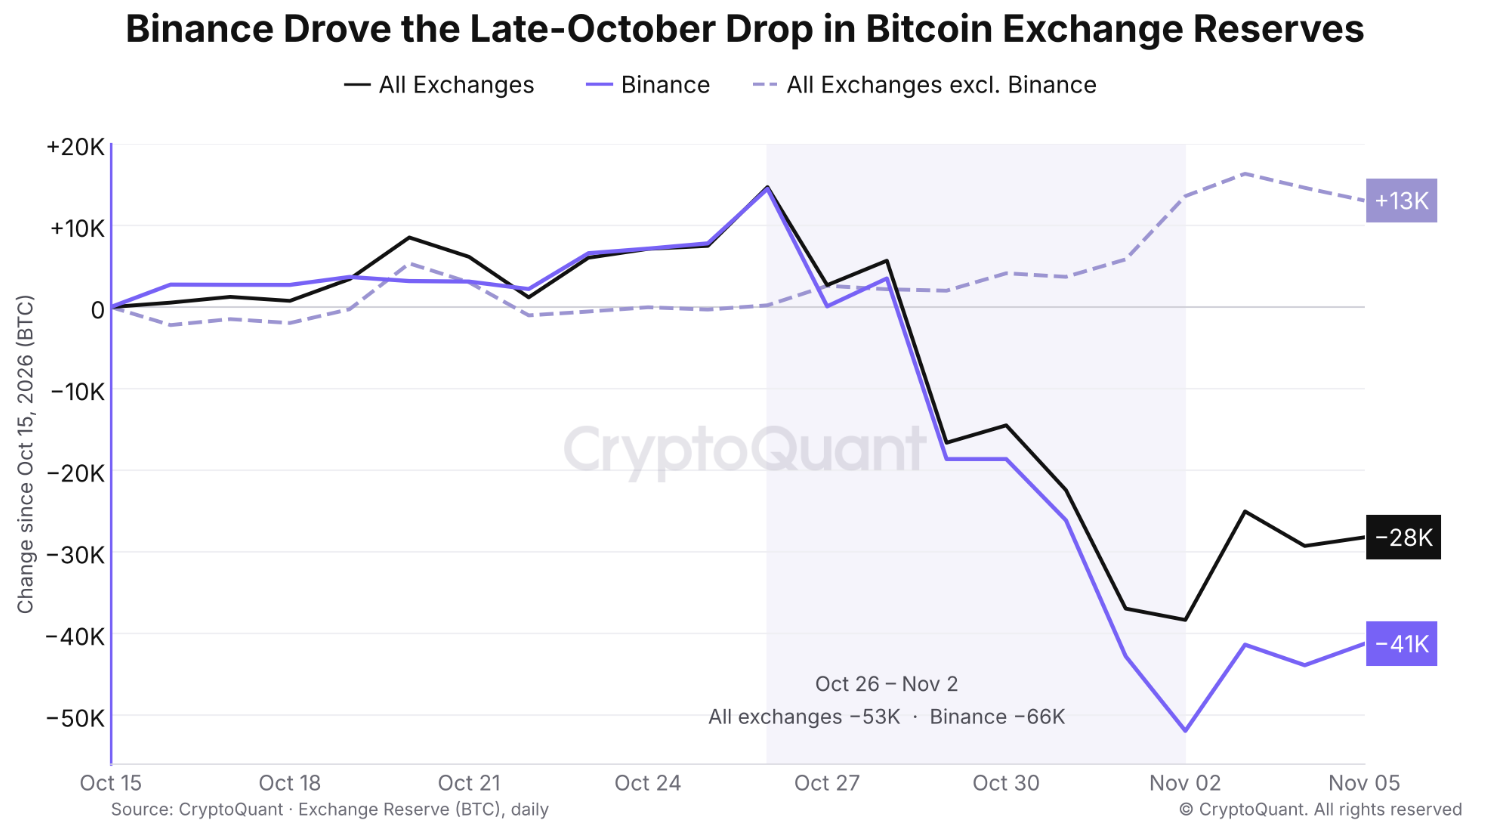
Late October 2026: Binance accounted for more than the entire market-wide drop.
Exchange reserve signals at a glance
Episode | Reserve move | Price move | Read |
|---|---|---|---|
Mar 11–13, 2020 | +74K BTC in 2 days | $7.9K → $4.8K | Panic spike at the crash low |
Nov 6–25, 2022 | −322K BTC | $20.9K → $15.8K | Fear-driven withdrawals, not accumulation |
Sep 2025 – May 2026 | −185K BTC | $109K → $81K | Supportive backdrop, no timing value |
Feb 5, 2026 | +12K BTC in 1 day | −14% | Local flush |
May 6 – Jun 30, 2026 | +80K BTC off the low | −28% | Warning: supply returning |
Aug 17–28, 2026 | −30K BTC | +21% | Confirmation of recovery |
Oct 26 – Nov 2, 2026 | −53K BTC | $80.1K → $76.8K | Single-exchange move; verify |
Exchange reserve vs netflow and other confirmations
Use exchange reserve as the slow backdrop, and pair it with faster or complementary metrics:
Exchange netflow: the daily change behind the reserve. Use it to time spikes. Reserve tells you where supply sits; netflow tells you what moved today.
SOPR and realized price: show whether the coins being deposited are being sold at a loss (capitulation) or a profit (distribution).
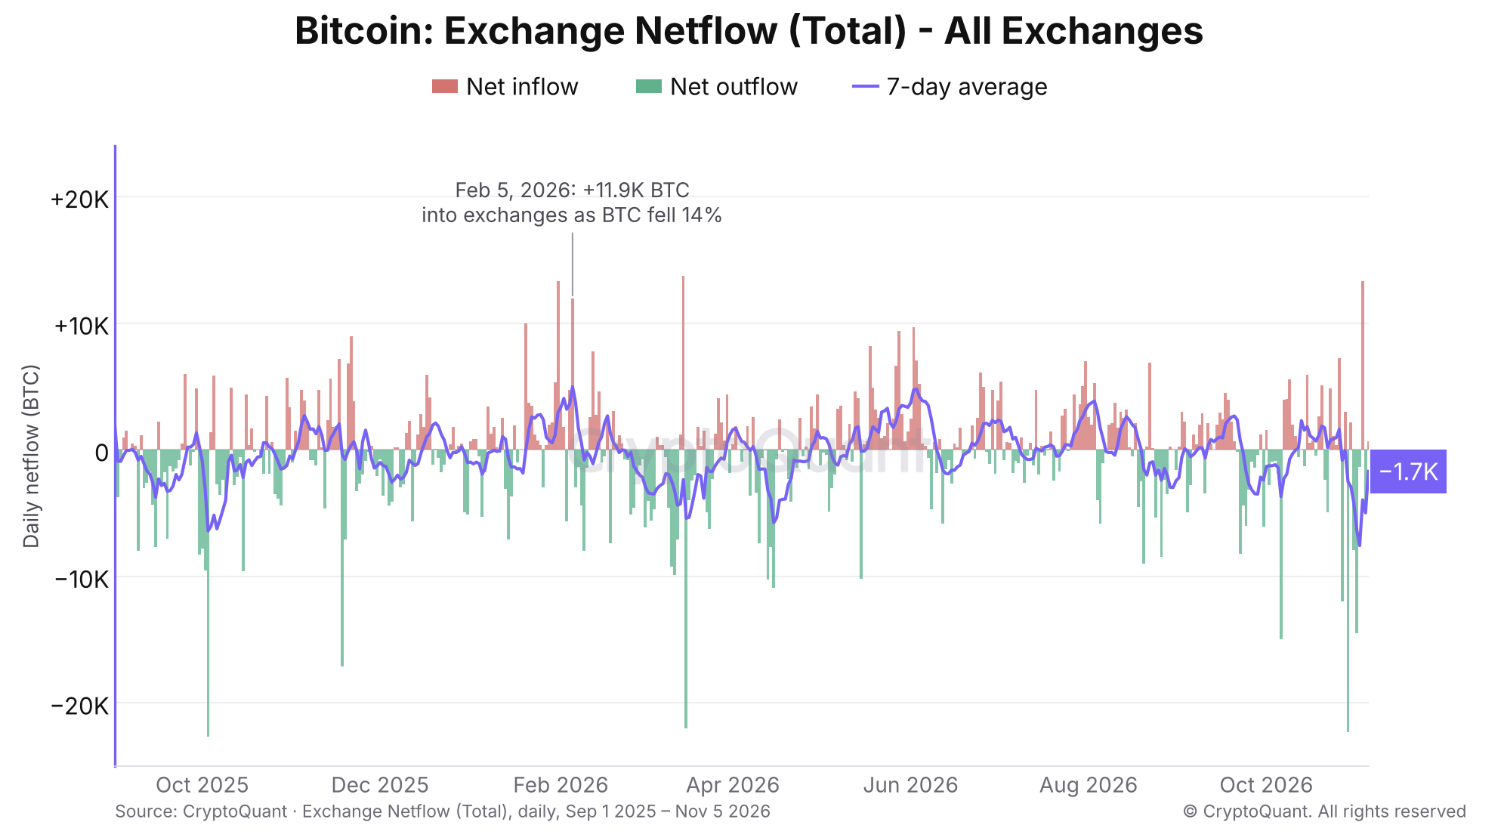
Netflow shows the day-by-day moves that reserve rolls up. The February 5 inflow spike is clearest here.
Track it live
Set an alert on the Bitcoin exchange reserve chart for sharp daily moves, or pull the full history by exchange through the CryptoQuant API (endpoint: /v1/btc/exchange-flows/reserve).
For the derivatives side of the same sell-offs, read Bitcoin funding rates and open interest: how to read a leverage flush.
For the same metric on Ethereum, where staking changes the reading, see Ethereum exchange reserve: what falling ETH supply on exchanges signals.
FAQ
Is a low Bitcoin exchange reserve bullish?
Over the long run, it's supportive: fewer coins are sitting ready to sell. But it isn't a timing signal. In May 2026, reserves hit a cycle low just before a 28% drop. What matters is whether reserves keep falling while price rises.
What does a rising exchange reserve mean?
More BTC is moving onto exchanges than leaving them, which adds potential sell-side supply. A sharp spike during a sell-off usually signals panic and often comes near a local low. A slow climb while price stalls is a warning.
What's the difference between exchange reserve and netflow?
Netflow is the daily difference between deposits and withdrawals. Exchange reserve is the running total of those netflows. Use netflow for timing and reserve for the trend.
Why do exchange reserve numbers differ between sites and over time?
Each provider identifies exchange wallets differently, and data is updated as new addresses are labelled. Compare the trend within a single data source rather than mixing figures from different providers or old articles.