
CryptoVizArt on Bitcoin's Recovery: On-Chain Regimes & Realized Cap | Unbiased Podcast
CryptoQuant.com
TL;DR
On-chain analyst CryptoVizArt of QFI Labs argues that Bitcoin has left its bear market. But on-chain history says the road back to the all-time high is slow. Recoveries have consistently taken longer than the bear markets before them. The market cap is currently outrunning realized cap at an unsustainable pace, so the most likely path is a staircase: rallies, plateaus and tests of support.
Regimes: classify the market by where price sits against cost-basis models before comparing it with history.
Timing: this recovery is about 108 days old, roughly 40% of the 267-day bear market. History implies around 200 more days.
Realized cap: $27 of market cap per $1 of new realized cap since mid-August. That ratio has always cooled before the next leg up.
Levels:
Support near the short-term holder cost basis, around $74K.
Heavy long-term holder supply at $98K–$106K.
A likely gravity point around $83K.
Regimes first, patterns second
Most analysts look for a past pattern and apply it to today. CryptoVizArt's objection is that they rarely agree on which stage the market is in, so they end up comparing unlike periods. His fix is to classify the regime with on-chain cost-basis models first, and only then compare the market with past periods in the same regime.
The framework compares spot price with two lines. True Market Mean is the cost basis of active supply, excluding miners and dormant coins. The short-term holder (STH) cost basis is the average purchase price of recent buyers. It moves faster than True Market Mean. The framework has six regimes in total. Four of them carry the story:
Regime | Condition | What it means |
|---|---|---|
Capitulation | Price below both lines, STH cost basis below True Market Mean | Both recent buyers and the broad market are underwater and selling |
Repair | Price between the STH cost basis and True Market Mean | Recent buyers are back in profit and confidence is rebuilding in a staircase pattern |
Breakout | Price above both lines after a sharp move off the low | Fast, vertical recovery, as in 2019 |
Advance | Price above both lines, STH cost basis above True Market Mean | Rising prices and profitable holders feed each other until demand is exhausted |
After nearly 200 days below the STH cost basis, price tested it twice in July and broke above it in August. That was an early sign the bear market was ending. Bitcoin is now in breakout.
Recoveries outlast bear markets
CryptoVizArt reset each cycle's clock to its low, and compared the time from the all-time high down to the low with the time from the low back up to that high.
Cycle | Drawdown | ATH to low | Low back to ATH |
|---|---|---|---|
2015 | 76–84% range | ~400 days | ~700 days |
2018 | 76–84% range | ~360 days | ~700 days |
2022 | 76–84% range | ~380 days | ~469 days |
2026 | ~50% | 267 days | Day 108 and counting |
The depth changed this cycle, but the ratio hasn't. Every recovery took longer than the bear market before it, about 1.97 times as long on average. Price fell by roughly 0.4–0.5% a day in bear markets and recovered at around 0.2% a day.
This recovery is about 40% of the way to simply matching the bear market's length. Julio Moreno applied the most recent cycle's ratio of 1.24 and got roughly 330 days in total, meaning about 200 more. CryptoVizArt's reason: confidence takes longer to rebuild than fear takes to spread. He thinks of it in orders of magnitude, hundreds of days rather than "next month", and says no one has offered evidence for a faster path.
Market cap runs ahead, realized cap catches up
CryptoVizArt calls realized cap "the mother of all metrics": the capital actually paid for every coin in circulation. Market cap is the valuation. Realized cap is the money. Every recovery runs through the same three phases:
1.
Washout. Market cap jumps while realized cap stalls or falls, as the last sellers who still think it's a bear market use the bounce to exit.
2.
Ignition. Realized cap starts rising 50–60 days after market cap, as coins change hands at higher prices.
3.
Plateau. Profit-taking reprices so many coins that market cap stalls. Once enough supply has been reabsorbed at the new range, there's fuel for the final leg to the all-time high.
Since mid-August, each $1 of net new realized cap has come with about $27 of market cap. That ratio always starts high after a bottom and cools until it stabilises. Julio's version of the metric settles between roughly 3 and 6 in late bull markets. Price stalling at $82K–$85K for two weeks, even as profit-taking rose sharply, looks like an early plateau. CryptoVizArt reads the resilience as positive: in a bear market, that much profit-taking would have pushed price much lower.
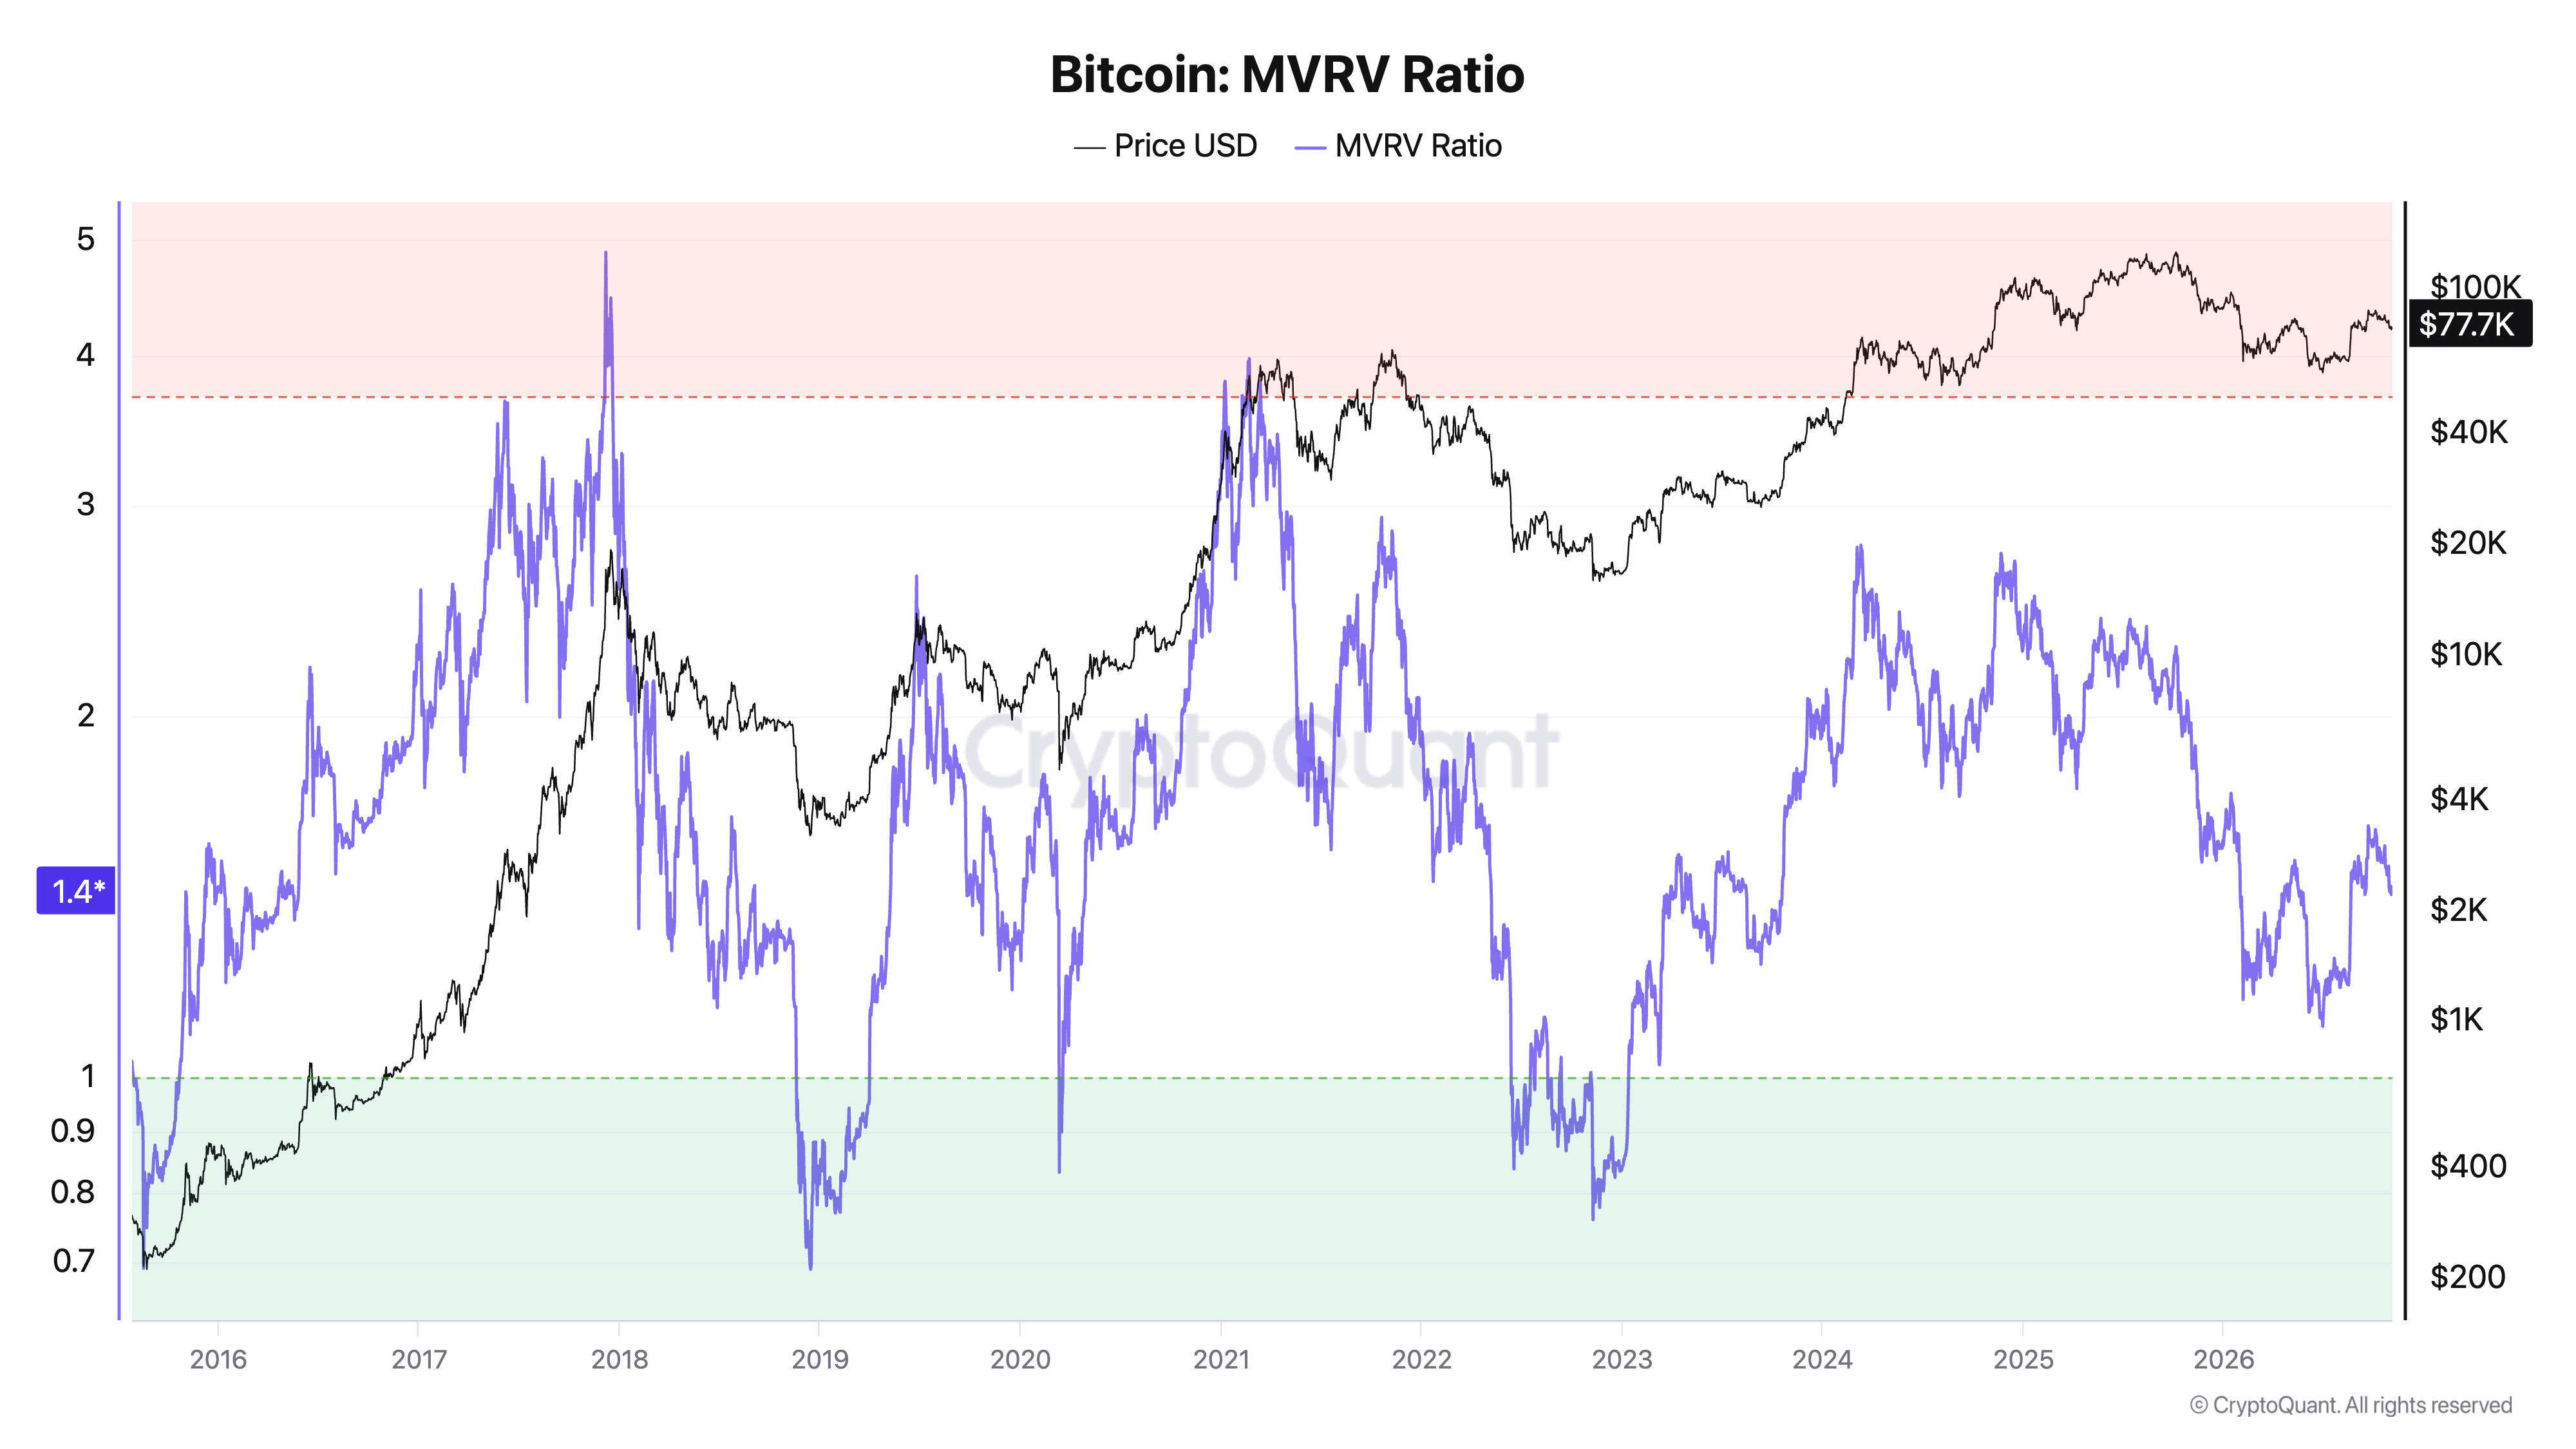
Source: CryptoQuant MVRV Ratio
The levels to watch
On-chain levels aren't technical lines the market has to respect, CryptoVizArt stresses. They show where supply is likely to create pain or exhaustion. All of these levels move as coins change hands.
Level | Price | Source |
|---|---|---|
Ceiling | $98K–$106K | 65th–75th percentile of long-term holder supply, where most recovery tops have stalled. A clean break above $106K would be a strong early signal. |
Upper band | ~$99K | STH MVRV of 1.25. About 95% of past recovery time was spent below it. |
Midpoint | ~$83K | Median of past recoveries. Expect price to spend a lot of time around here. |
True Market Mean | ~$77K | Price needs a few months above this so the STH cost basis can rise above it. That's the condition for advance and a new all-time high. |
Support | ~$74K | STH cost basis, STH MVRV of 1. About 93% of recovery time was spent above it, and dips to it marked local bottoms. |
Julio's support | ~$71K | 1–3 month holder cost basis, up from $64K at the end of September. |
The main sellers are long-term holders who bought near the 2025–26 top. They have been worn down by the bear market and are selling at breakeven. This cycle had an unusually heavy top. Institutional holders proved more resilient than CryptoVizArt expected, which is likely why the drawdown stopped near 50%.
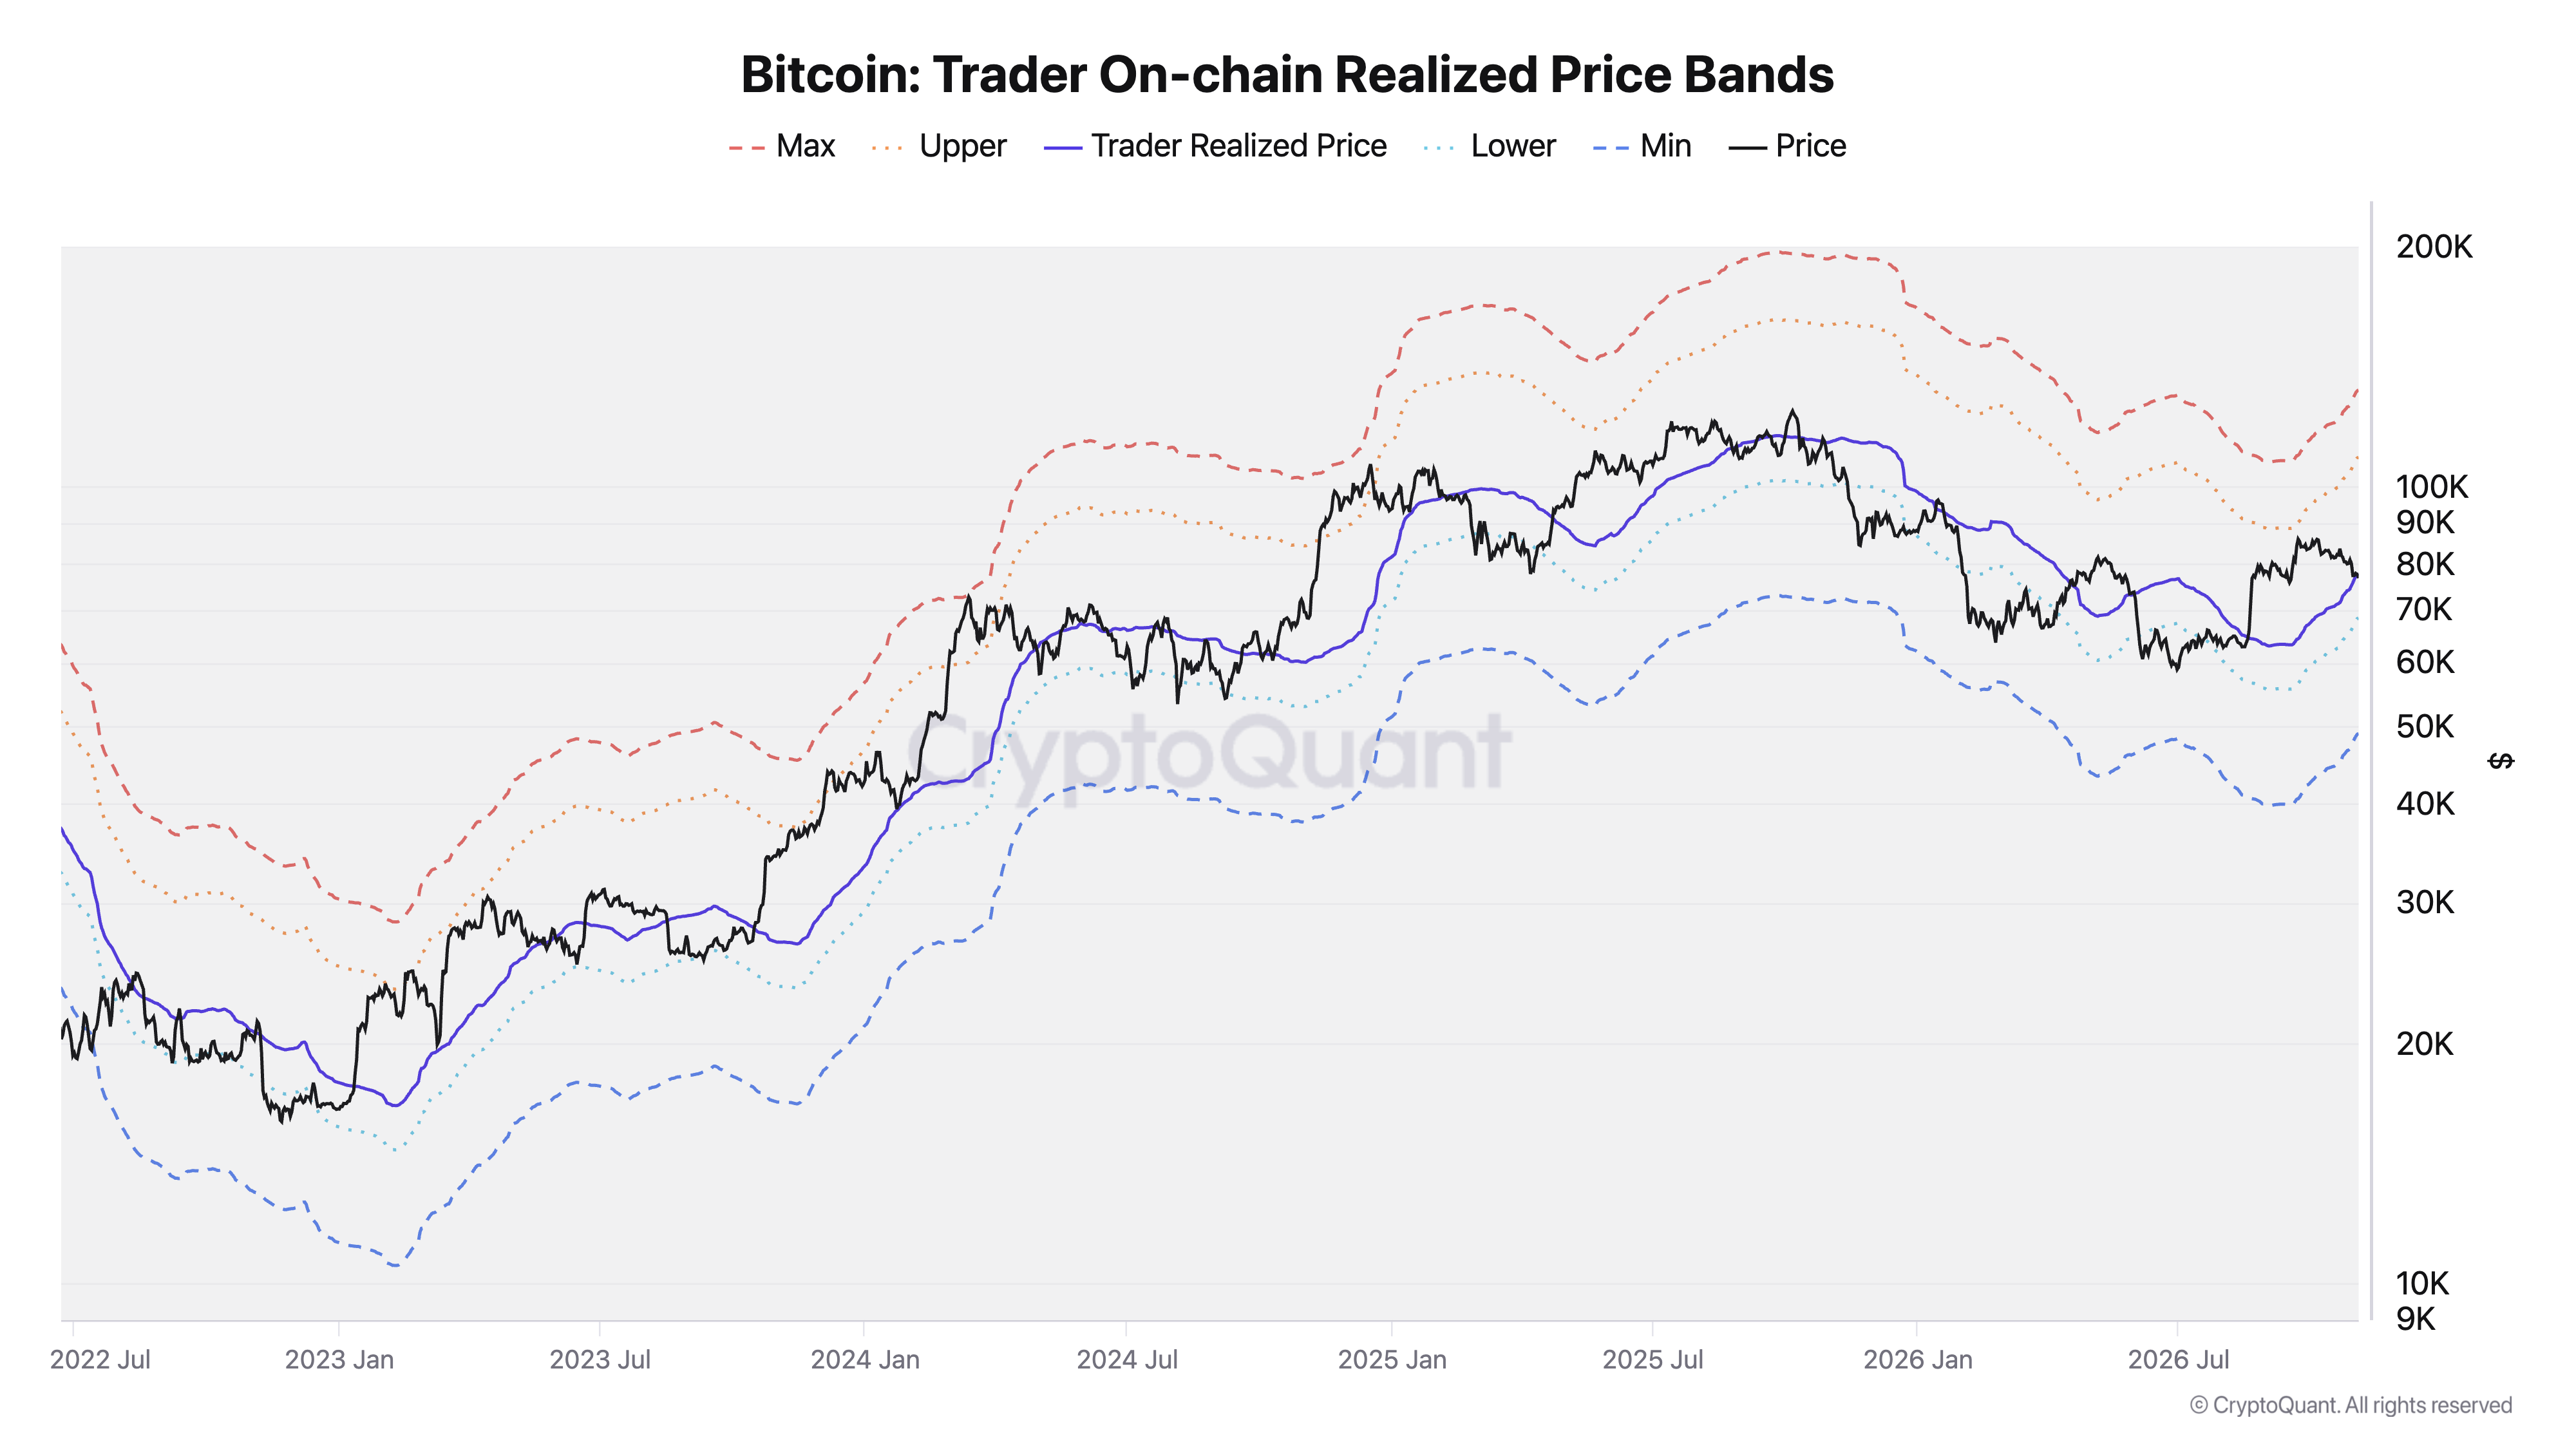
Source: CryptoQuant Trader On-chain Realized Price Bands
Advice for new investors
CryptoVizArt's background is in oil and gas, not finance. He turned to on-chain analysis after riding XRP up in 2018 and back down to almost nothing. His two rules:
Don't act on analysis you don't fully understand, whether it's the metric, the method or what could make it wrong. Every analyst is biased by their own situation, however good their intentions.
DCA into hard assets while you learn. He expects monetary expansion to continue. He also argues that a handful of days drive most of a bull market's gains, so trading in and out risks missing them.
Listen to the full episode
Track these metrics live on CryptoQuant. Start free.
FAQ
Who is CryptoVizArt?
CryptoVizArt is an on-chain analyst and co-founder of the QFI Labs research newsletter. He uses quantitative, regime-based on-chain analysis, written from a buy-side perspective.
How long does Bitcoin take to recover to its previous all-time high?
In past cycles, the recovery from the cycle low back to the prior high took longer than the bear market itself, about 1.24 to 2 times as long. Applied to this cycle, that implies roughly 200 more days from early November 2026.
What is the short-term holder cost basis?
It's the average price recent buyers paid for their coins. In bull markets it acts as dynamic support, and short-term holder MVRV near 1 has marked local bottoms.
What does realized cap vs market cap show?
Realized cap tracks the capital actually invested in Bitcoin, while market cap tracks valuation. Early in a recovery, market cap grows much faster than realized cap. That gap has historically narrowed and stabilised before the final rally to a new high.