
How to Spot Bitcoin Cycle Tops with MVRV
CQ Insights
MVRV has not closed above 3.7 since March 13, 2021, and it read 2.86 and 2.29 at the last two Bitcoin cycle tops. Both price highs came with MVRV more than 10% below its one-year high. Since 2012, days with that divergence were followed by a median −23.6% over one year, against +84.6% for all days.
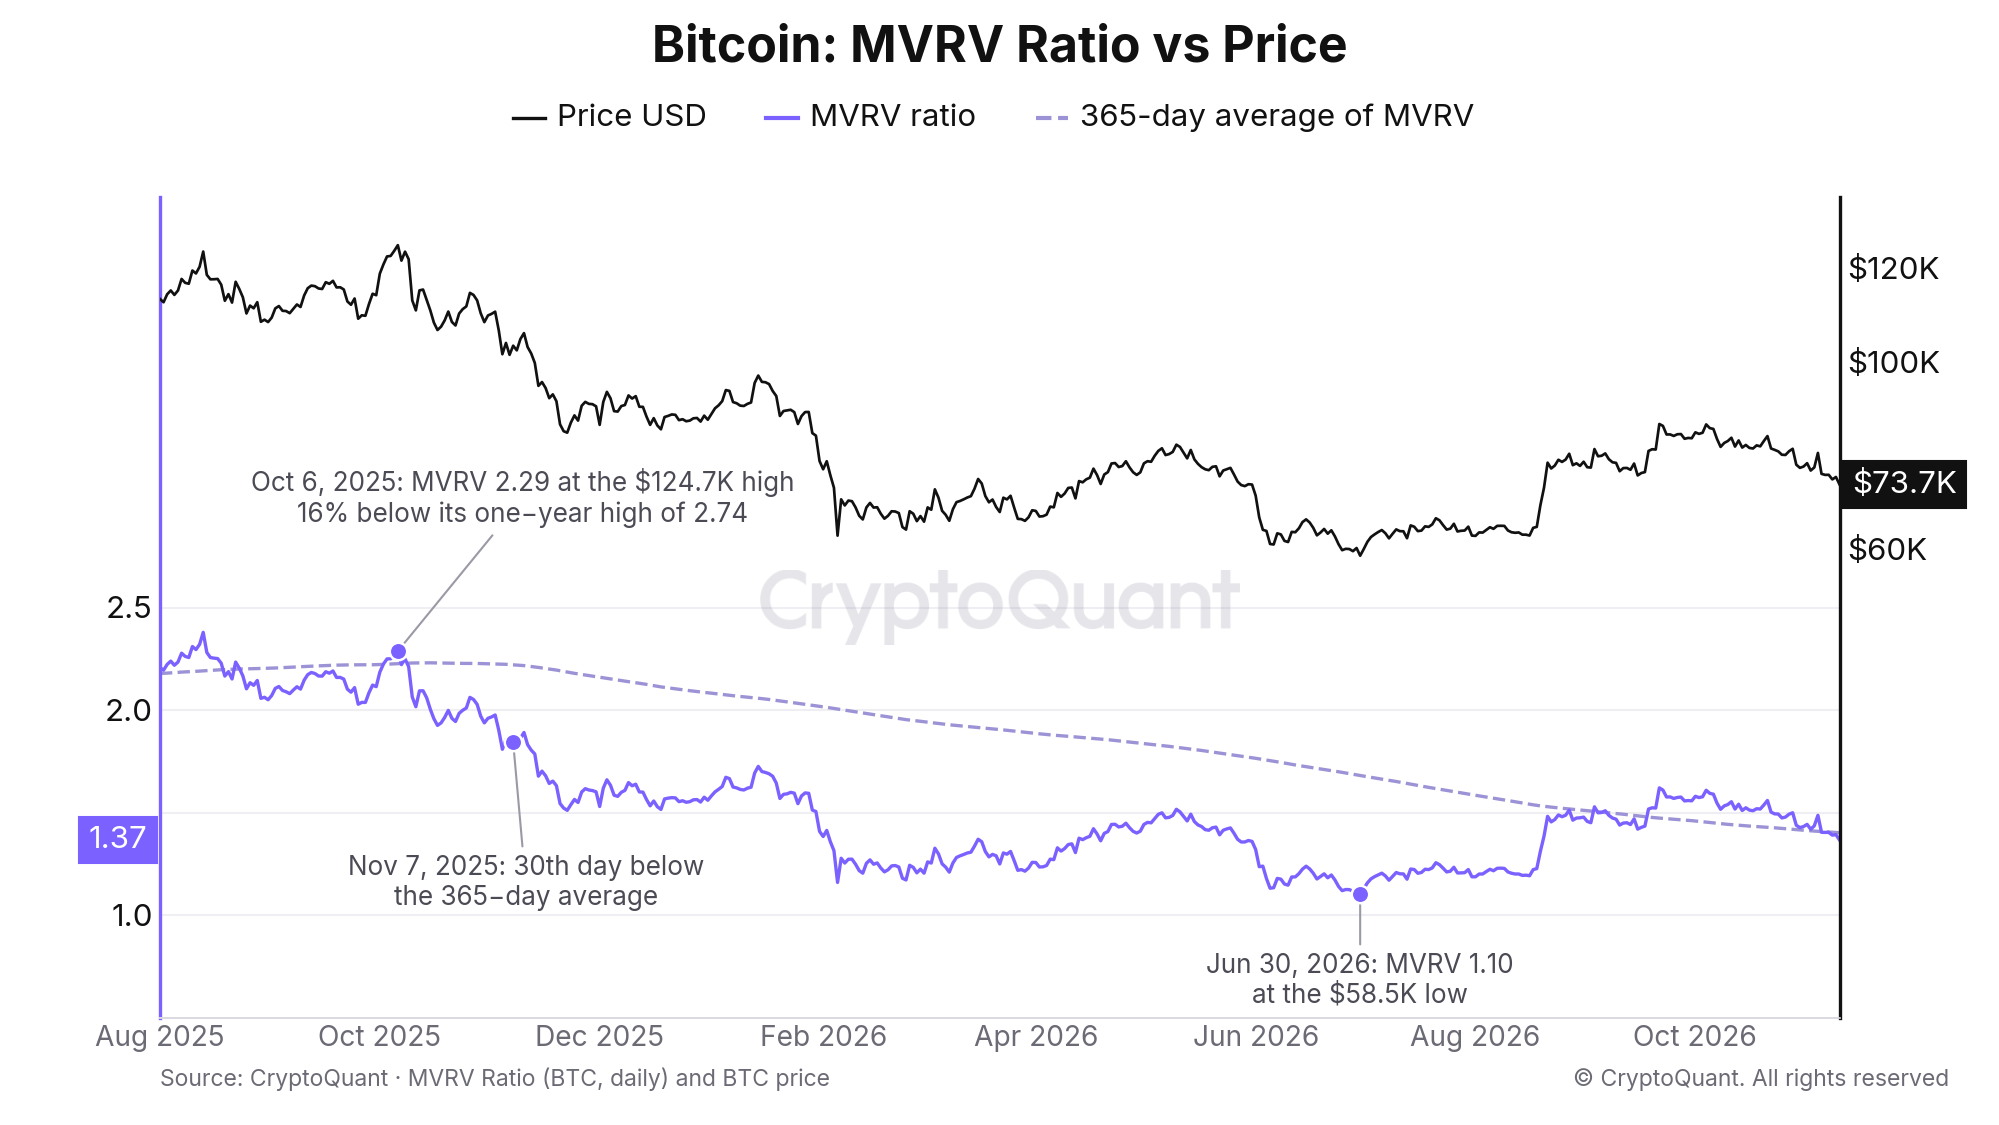
MVRV (purple) with its 365-day average (dashed) against the BTC price (black), August 2025 to November 10, 2026. MVRV read 2.29 at the $124,710 high on October 6, 2025, 16.4% below its one-year high of 2.74. Source: CryptoQuant.
MVRV, explained
The MVRV ratio is Bitcoin's market capitalization divided by its realized capitalization, which values every coin at the price of its last on-chain move. On November 10, 2026, market cap was $1.484 trillion against a realized cap of $1.085 trillion, a ratio of 1.37. The MVRV user guide covers the calculation and labels readings above 3.7 a possible market top.
Realized price is realized cap per coin, $53,955 on November 10. NUPL restates MVRV as a share of market cap, 0.27 on the same day. Since January 2012 the median MVRV is 1.68. MVRV moves over months. Our funding rates and open interest playbook covers leverage, which moves in days.
What the backtest shows
The test uses daily MVRV and the BTC price from January 1, 2012 to November 10, 2026, 5,428 days. A cycle top here is an all-time-high close followed by a fall of more than 50%. There are six: April 9, 2013, December 4, 2013, December 16, 2017, April 13, 2021, November 8, 2021 and October 6, 2025.
A spike is a close more than two standard deviations above the mean of the previous 365 days, 1.74 at today's levels. Spikes within seven days of each other count once, which turns 630 spike days into 29 events. A divergence is a day when price closes within 5% of its all-time high while MVRV is 10% or more below its one-year high. A break is the 30th straight day with MVRV below its 365-day average.
Setup | Days or events | 30-day median | 90-day median | 365-day median | Up after 365 days |
|---|---|---|---|---|---|
All days (baseline) | 5,428 | +3.2% | +10.1% | +84.6% | 71% |
MVRV spike (two sigma) | 29 events | +14.1% | +20.9% | +109.2% | 79% |
MVRV above 3.7, every day | 75 | −3.2% | −28.8% | −22.5% | 41% |
Price near its high, MVRV confirms | 250 | +18.3% | +61.2% | +134.6% | 72% |
Price near its high, MVRV diverges | 253 | −1.4% | +3.8% | −23.6% | 35% |
30 days below the 365-day average | 12 events | +3.9% | +12.7% | −21.3% | 42% |
Same, within 100 days of an all-time high | 8 events | −7.9% | +6.7% | −34.6% | 1 of 8 |
The divergence row carries the cycle-top signal, with one caveat. Of the 253 divergence days, 102 fell in 2025, and none of those was followed by a higher price a year later. The other 151 returned a median +11.0% over a year, with 59% higher. That is still far below the +134.6% when MVRV confirmed the high. The near-high rows are overlapping daily observations from six years, and the break rows have 12 and 8 events. Treat all of them as tendencies, not rules.
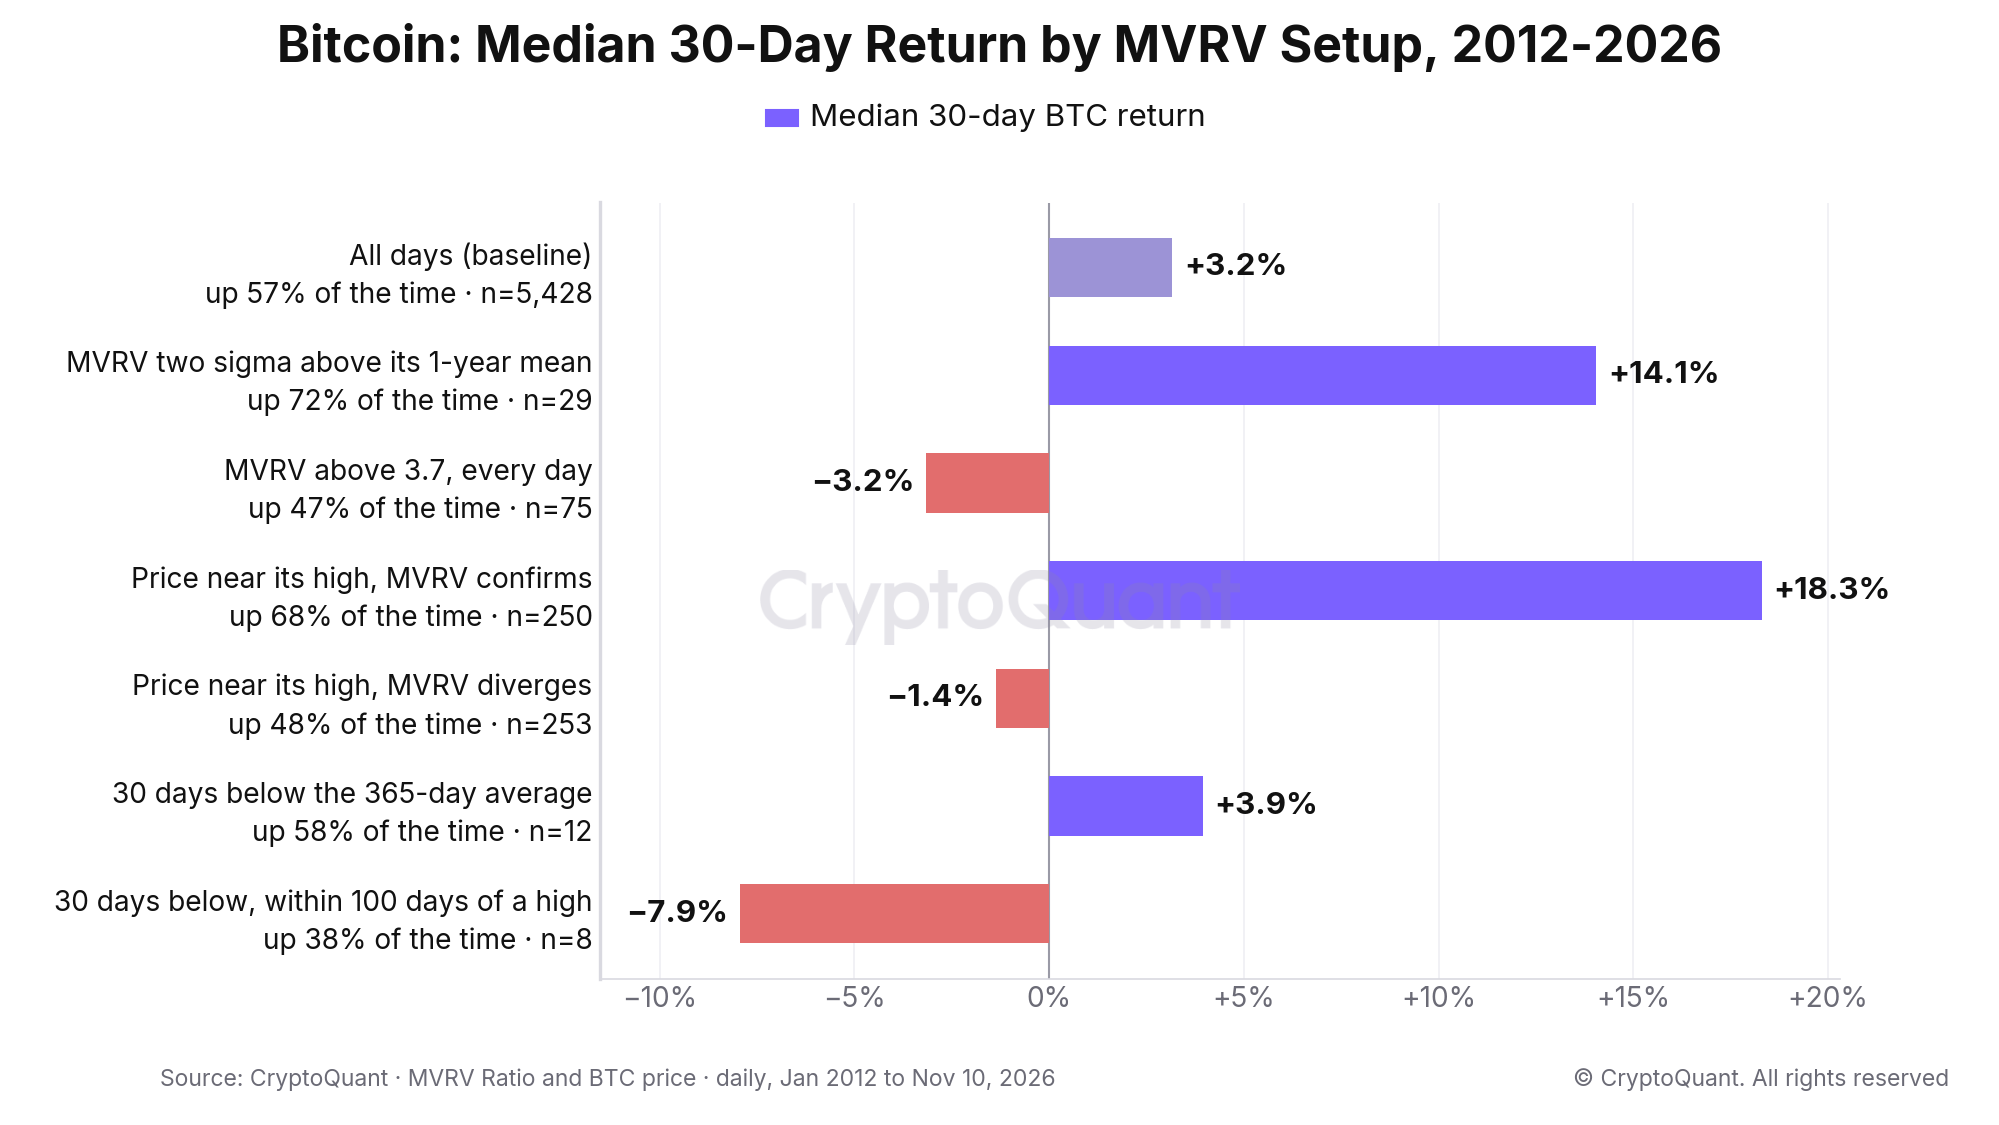
Median 30-day BTC return by MVRV setup, January 2012 to November 10, 2026: +18.3% when a price high came with MVRV near its own one-year high and −1.4% when MVRV diverged, against +3.2% for all days. Source: CryptoQuant.
How to read MVRV near a price high
1. A one-year high in MVRV is momentum, not a top
The 29 spikes were followed by a median +14.1% over 30 days and +109.2% over a year. On November 11, 2024, MVRV closed at 2.62 against a spike line of 2.55 with BTC at $88,727. BTC was 14.1% higher 30 days later and 16.1% higher after a year.
The exception came five weeks later. On December 16, 2024, MVRV closed at 2.70 with BTC at $106,075. BTC was 5.3% lower after 30 days and 17.2% lower after a year. There has been no spike since.
2. Watch for a price high that MVRV does not confirm
In 2021, MVRV peaked at 3.98 on February 21 with BTC at $57,462. At the April 13 high of $63,573 it read 3.44, 13.5% lower, and BTC fell 53.1% to $29,808 by July 20. At the November 8 high of $67,551 it read 2.86, 28.2% below the February peak. BTC was 25.2% lower after 30 days and 72.5% lower after a year.
The same pattern came back in 2025. MVRV's one-year high was 2.74 on November 21, 2024 with BTC at $98,430. At the October 6, 2025 high of $124,710 it read 2.29, 16.4% lower, and BTC fell 53.1% to $58,535 by June 30, 2026. Coins that change hands at higher prices lift the realized cap, so a later price high needs a larger gain to reach the same MVRV.
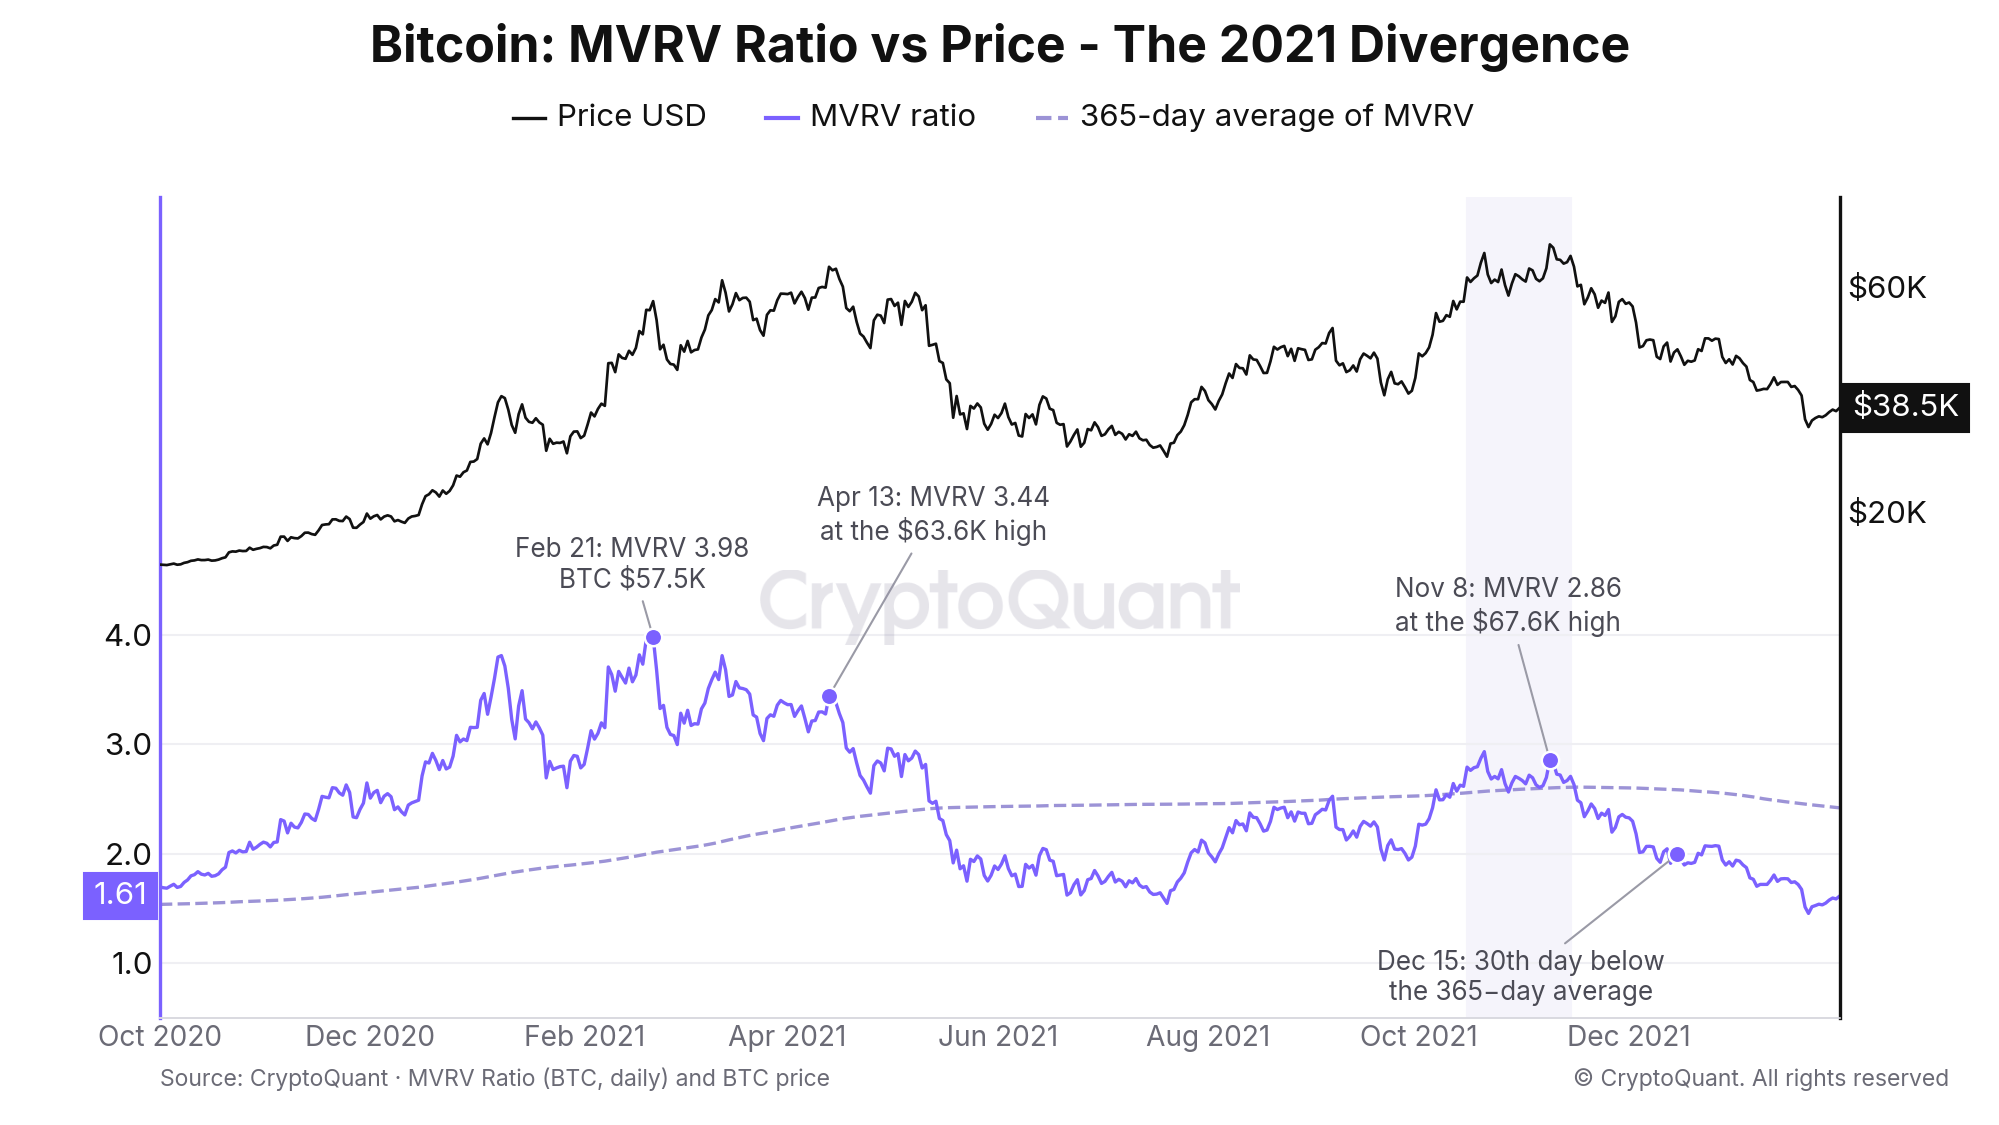
October 2020 to January 2022: MVRV closed at 3.98 on February 21, 2021, then read 3.44 at the April 13 price high of $63,573 and 2.86 at the November 8 high of $67,551. The 30th straight day below its 365-day average came on December 15. Source: CryptoQuant.
3. Confirm with 30 straight days below the 365-day average
Divergence is early. In 2025 it showed on 86 days between May 8 and October 9. The break of the 365-day average is late but cleaner. After the last four cycle tops, the 30th day below the average came 55, 61, 37 and 32 days after the high, with BTC already 55.0%, 38.6%, 27.6% and 17.2% below it. BTC then fell a further 63.1%, 23.6%, 67.7% and 43.3% to its low.
Eight of the 12 breaks since 2012 came within 100 days of an all-time-high close. Seven of those were lower a year later, with a median of −34.6%. The four later breaks were all higher a year later.
4. Compare the peak with the last cycle's peak, not a fixed level
Each cycle's highest MVRV has been lower than the last: 5.91 in November 2013, 4.88 in December 2017, 3.98 in February 2021 and 2.78 in March 2024. In the last two cycles it also came long before the final price high, 260 and 574 days, against 16 and 9 days in 2013 and 2017.
When MVRV misleads
Waiting for 3.7. MVRV closed above 3.7 on 75 days since 2012: 51 in 2013, 14 in 2017 and 10 in early 2021, the last on March 13. Those days were followed by a median −22.5% over a year, so the level worked when it was reached. It has not been reached in the 2,068 days through November 10, 2026, a stretch that includes two cycle tops.
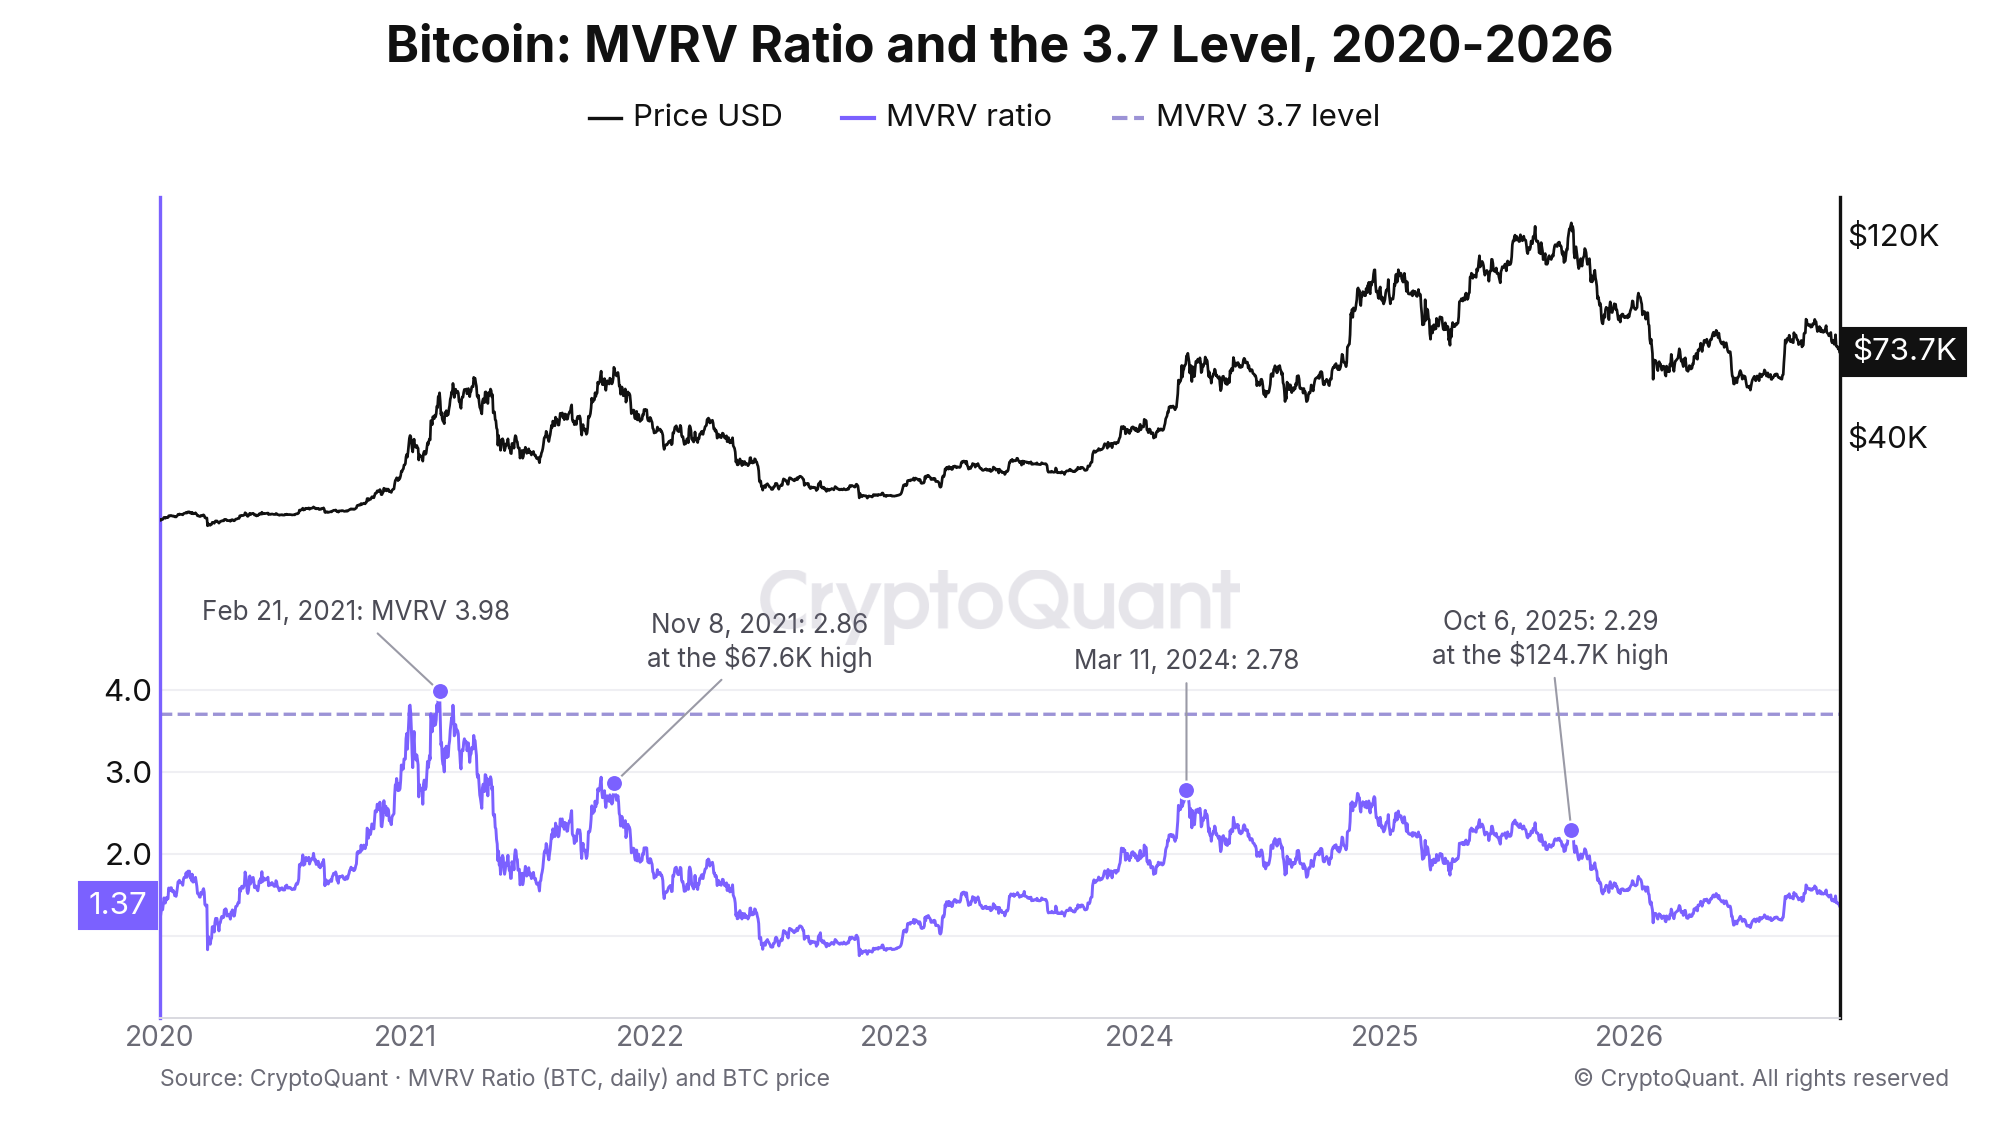
MVRV and the 3.7 level, January 2020 to November 10, 2026. The last close above 3.7 was March 13, 2021. MVRV read 2.86 at the November 8, 2021 high and 2.29 at the October 6, 2025 high. Source: CryptoQuant.
Early divergences in a strong run. On November 4, 2013, BTC closed at $227 with MVRV 46.8% below its one-year high. BTC was 402.2% higher 30 days later. On November 6, 2024, MVRV read 2.27, 18.5% below its high, with BTC at $75,645. BTC was 32.0% higher after 30 days and 34.0% higher after a year.
False breaks of the 365-day average. On December 20, 2019, the 30th day below the average came 734 days after the high, with BTC at $7,202 and 62.6% below it. BTC was 230.9% higher a year later. On March 22, 2025, the break came 60 days after the January high with BTC at $83,843. BTC reached $124,710 on October 6 and was still 19.1% lower a year after the break.
A five-step checklist
1.
Open the MVRV chart and compare the reading with its one-year high and its 365-day average.
2.
Check how far price is below its all-time-high close. The divergence rule applies within 5%.
3.
Measure the gap between MVRV and its one-year high. A gap of 10% or more at a price high is the divergence.
4.
Count the days below the 365-day average. Thirty in a row within 100 days of a high has been the confirmation.
5.
Look for confirmation elsewhere: long-term holder SOPR, supply in profit and the MVRV Z-score, a normalized version of the same comparison. Our Bitcoin whale ratio playbook and exchange netflow playbook cover the deposits side.
What MVRV is saying now
As of November 10, 2026, MVRV is 1.37 with BTC at $73,702. That is below the 1.68 median, and 31.5% of days since 2012 closed lower. BTC is 40.9% below its $124,710 close of October 6, 2025, 400 days ago, so the divergence rule is not in play.
MVRV spent 349 of those 400 days below its 365-day average. It bottomed at 1.10 on June 30, 2026 with BTC at $58,535, then held above the average for 48 straight days from September 18.
On November 5, MVRV closed back below the average, 1.405 against 1.409. It is at 1.37 against 1.40, six days in. A 30th day would fall on December 4, 2026, more than 100 days after the high. There have been four such breaks since 2012 and all were higher a year later, which is too few to lean on.
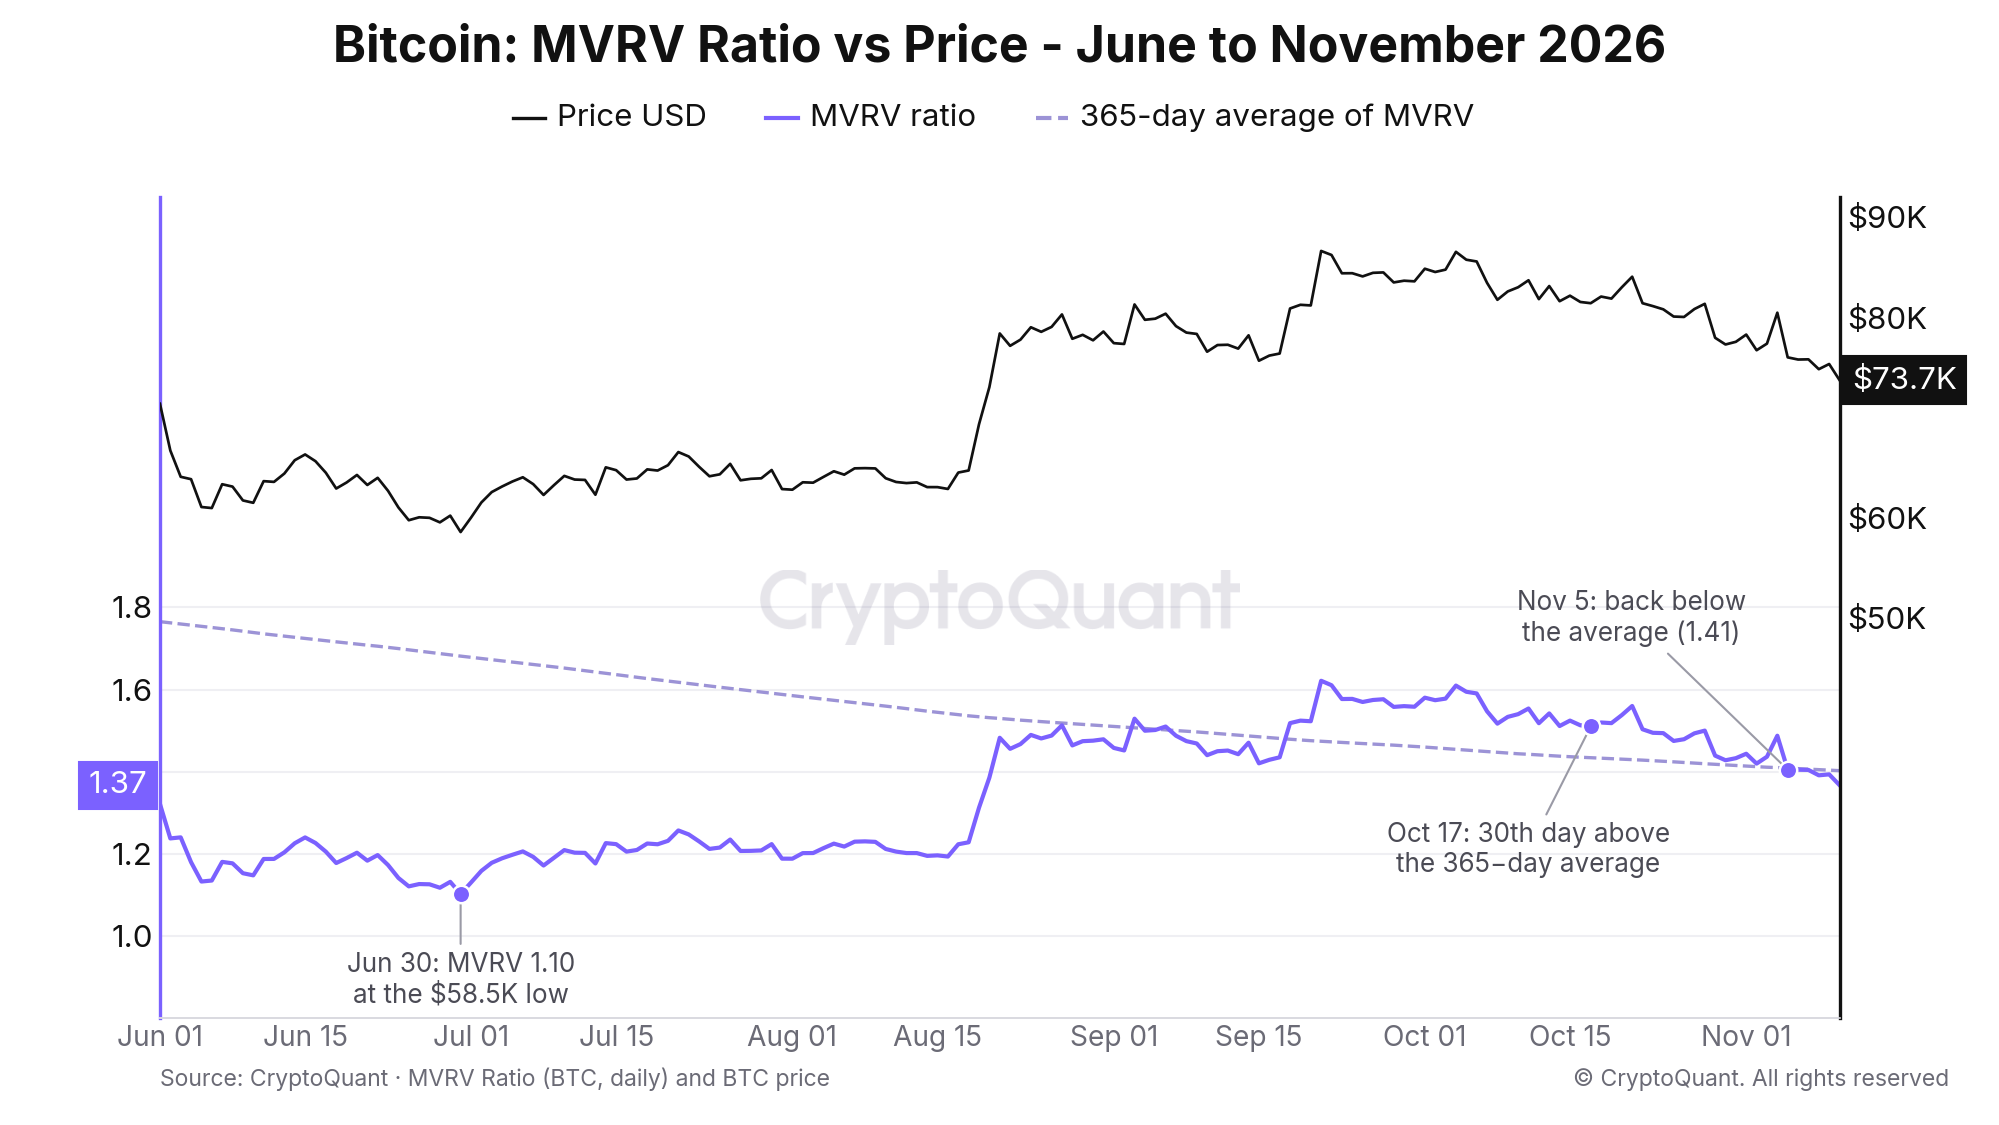
June 1 to November 10, 2026: MVRV bottomed at 1.10 on June 30, held above its 365-day average for 48 straight days from September 18 and closed back below it on November 5. It read 1.37 on November 10 with BTC at $73,702. Source: CryptoQuant.
Track it live
Paired chart: Bitcoin MVRV ratio chart
API: /v2/indicator/unrealized-pnl/mvrv and /v1/btc/market-data/price-ohlcv through the CryptoQuant API
MCP: pull the same series into your agent with CryptoQuant MCP
FAQ
What is a high MVRV ratio?
Since 2012 the median daily MVRV for Bitcoin is 1.68. One day in ten closed above 2.67, one in twenty above 3.06 and one in a hundred above 3.99. Each cycle's peak has been lower than the last, so compare a reading with its past year on the MVRV ratio chart rather than with a fixed level.
Is MVRV above 3.7 a reliable top signal?
It was when it occurred. The 75 days above 3.7 between 2012 and 2021 were followed by a median −22.5% over a year. The cycle tops of November 2021 and October 2025 came with MVRV at 2.86 and 2.29, so the level missed both.
How is MVRV calculated?
It is market capitalization divided by realized capitalization. Realized cap values each coin at the price of its last on-chain move. The realized price chart shows that cost per coin.
What is the difference between MVRV and NUPL?
They are the same data in two forms. NUPL equals 1 minus 1 divided by MVRV, so an MVRV above 1 means a positive NUPL. The NUPL chart reads as the share of market cap that is unrealized profit.
What does MVRV below 1 mean?
The market values Bitcoin below the aggregate price at which its coins last moved. That happened on 664 days between 2012 and January 2023. BTC was higher a year later after 99% of them, with a median gain of 97.6%.