
Ethereum Exchange Reserve: What Falling ETH Supply on Exchanges Signals
CQ Insights
ETH supply on exchanges has fallen 59% since June 2020, from 35.5 million to 14.6 million ETH. A falling Ethereum exchange reserve alone is not a signal, because the reserve falls on 65% of days. Since 2020, ETH returned a median +4.7% over 30 days when the reserve fell while price rose, against +2.0% for all days.
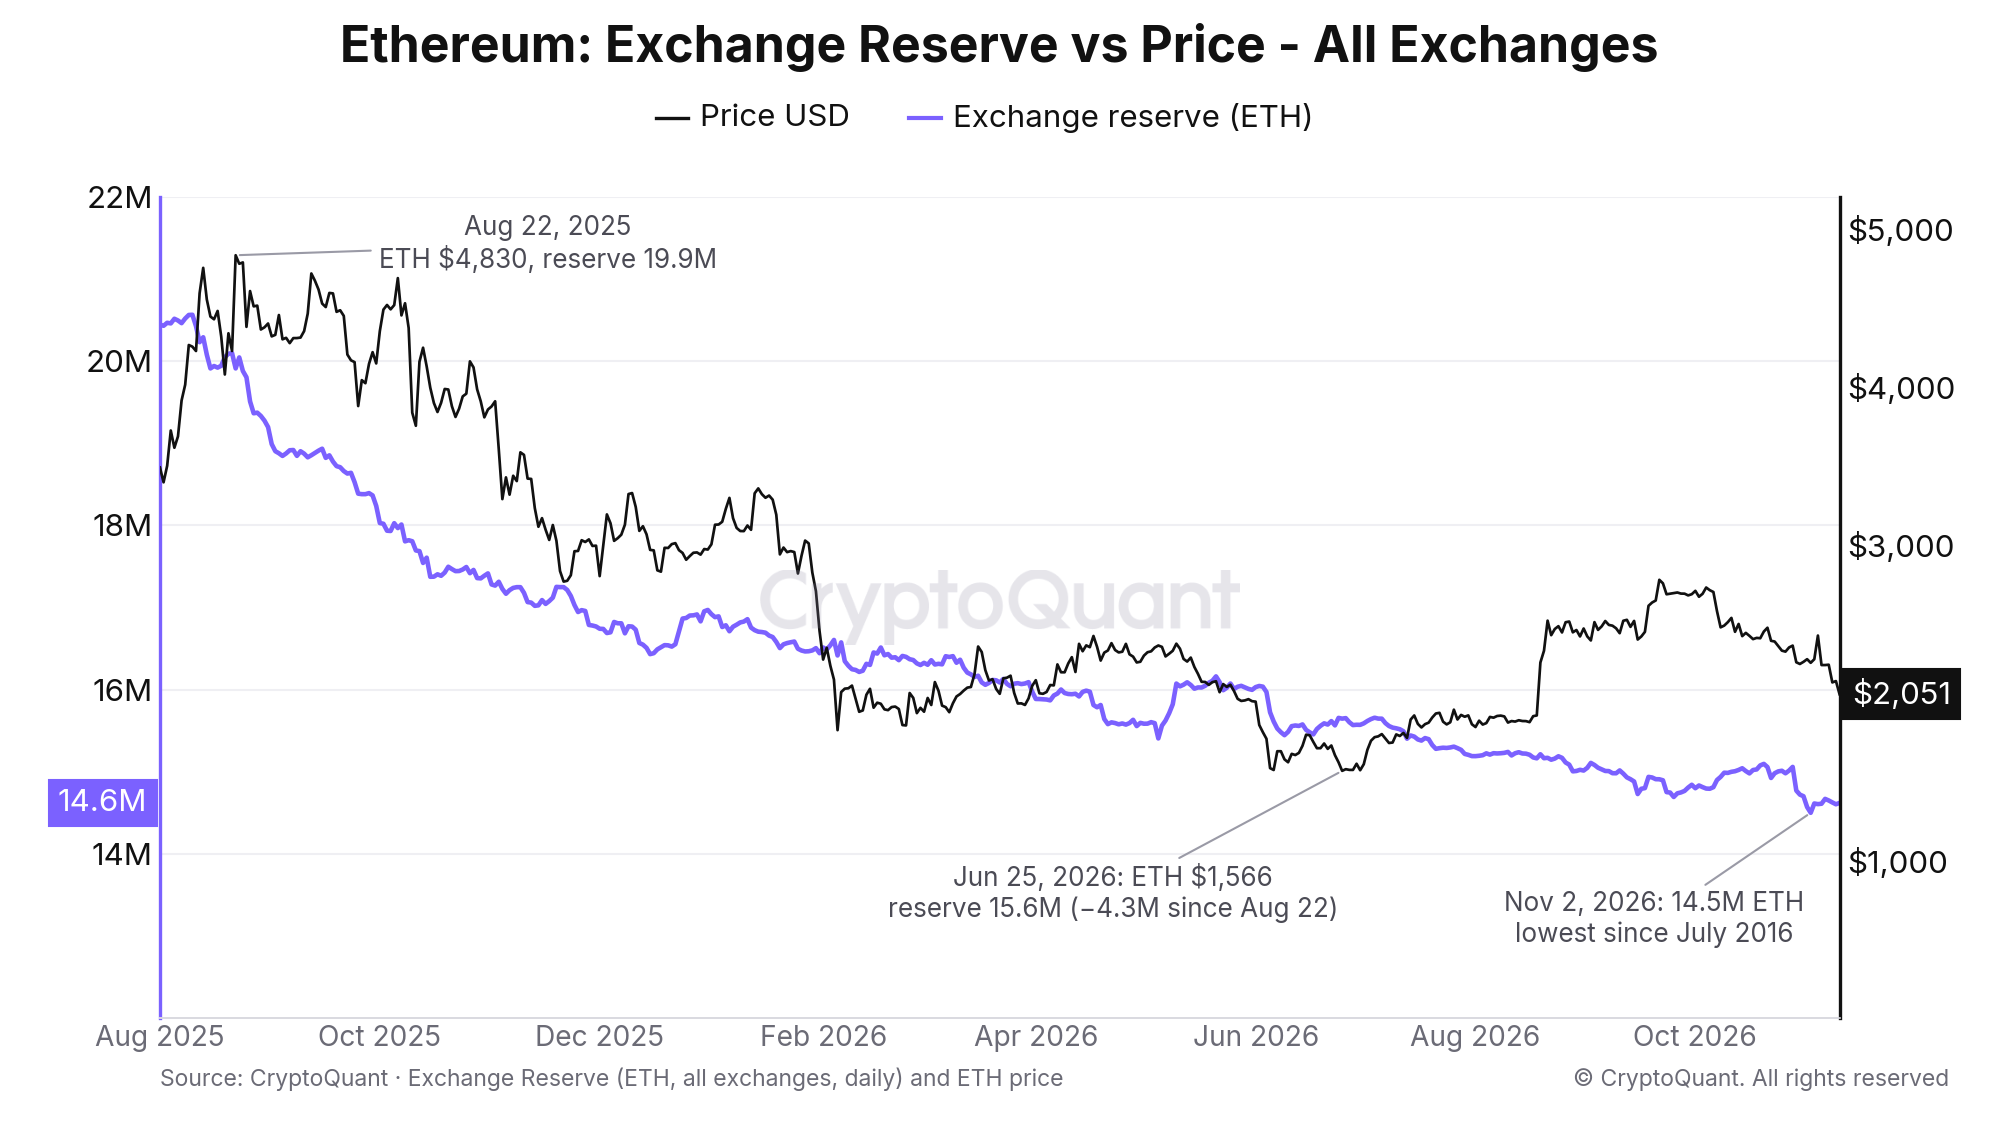
Ethereum exchange reserve (purple) against the ETH price (black), August 2025 to November 10, 2026. From August 22, 2025 the reserve fell from 19.9 million to 14.6 million ETH while ETH fell from $4,830 to $2,051. Source: CryptoQuant.
Ethereum exchange reserve, explained
The Ethereum exchange reserve is the total ETH held in wallets that CryptoQuant attributes to exchanges. It is the running total of ETH exchange netflow, which is deposits minus withdrawals. Between January 1, 2020 and November 10, 2026 the sum of daily netflow equals the change in reserve exactly. The exchange reserve user guide covers the calculation, and our Bitcoin exchange reserve playbook covers the basic reading.
ETH differs from Bitcoin in two ways. The decline is far larger. The reserve peaked at 35,506,476 ETH on June 5, 2020. On November 10, 2026 it was 14,620,265 ETH, and the exchange supply ratio had gone from 31.9% to 12.4%. Over the same span the Bitcoin exchange reserve went from 2,889,228 to 2,861,902 BTC, a decline of less than 1%. ETH also has places to go that Bitcoin does not. Staked ETH stood at 44,596,618 on November 10, 2026, three times the exchange reserve, and 54% of the reserve sits on derivative exchanges as collateral.
What the backtest shows
The test uses the daily all-exchange reserve and the ETH price from January 1, 2020 to November 10, 2026, which is 2,506 days. It covers two kinds of signal. The first is the trend, measured as the 30-day change in reserve and split by whether ETH rose or fell over the same 30 days. These are overlapping daily observations, so they describe regimes rather than independent events. The second is the spike, a one-day reserve change more than two standard deviations from its trailing 365-day mean. At today's levels that is a drop of more than 125,930 ETH in a day. Spikes within seven days of each other count once. Returns run from the day's close, and the median is reported with the share of cases that closed higher.
Setup | Days or events | 30-day median | Up after 30 days | 90-day median |
|---|---|---|---|---|
All days (baseline) | 2,506 | +2.0% | 54% | +11.0% |
Reserve falling, price rising (30-day changes) | 915 | +4.7% | 61% | +13.5% |
Reserve falling, price falling | 709 | +0.5% | 51% | +10.1% |
Reserve rising, price rising | 453 | +2.4% | 54% | +7.5% |
Reserve rising, price falling | 429 | −5.0% | 46% | +11.0% |
One-day outflow spike (two sigma) | 53 | +2.0% | 58% | +10.4% |
Outflow spike led by spot exchanges | 23 | +4.4% | 68% | +9.8% |
Sharp 30-day decline (two sigma) | 8 | +18.4% | 75% | +20.9% |
Sharp 30-day rise (two sigma) | 9 | −3.0% | 33% | +11.2% |
The reserve was lower than 30 days earlier on 65% of days. Those days returned a median +2.8% over 30 days, less than one percentage point above the baseline. The edge shows up when price confirms the trend, and the clear negative is a reserve that rises while price falls. One-day outflow spikes match the baseline unless spot exchanges led them. The sharp 30-day signals have eight and nine events, so treat them as tendencies, not rules.
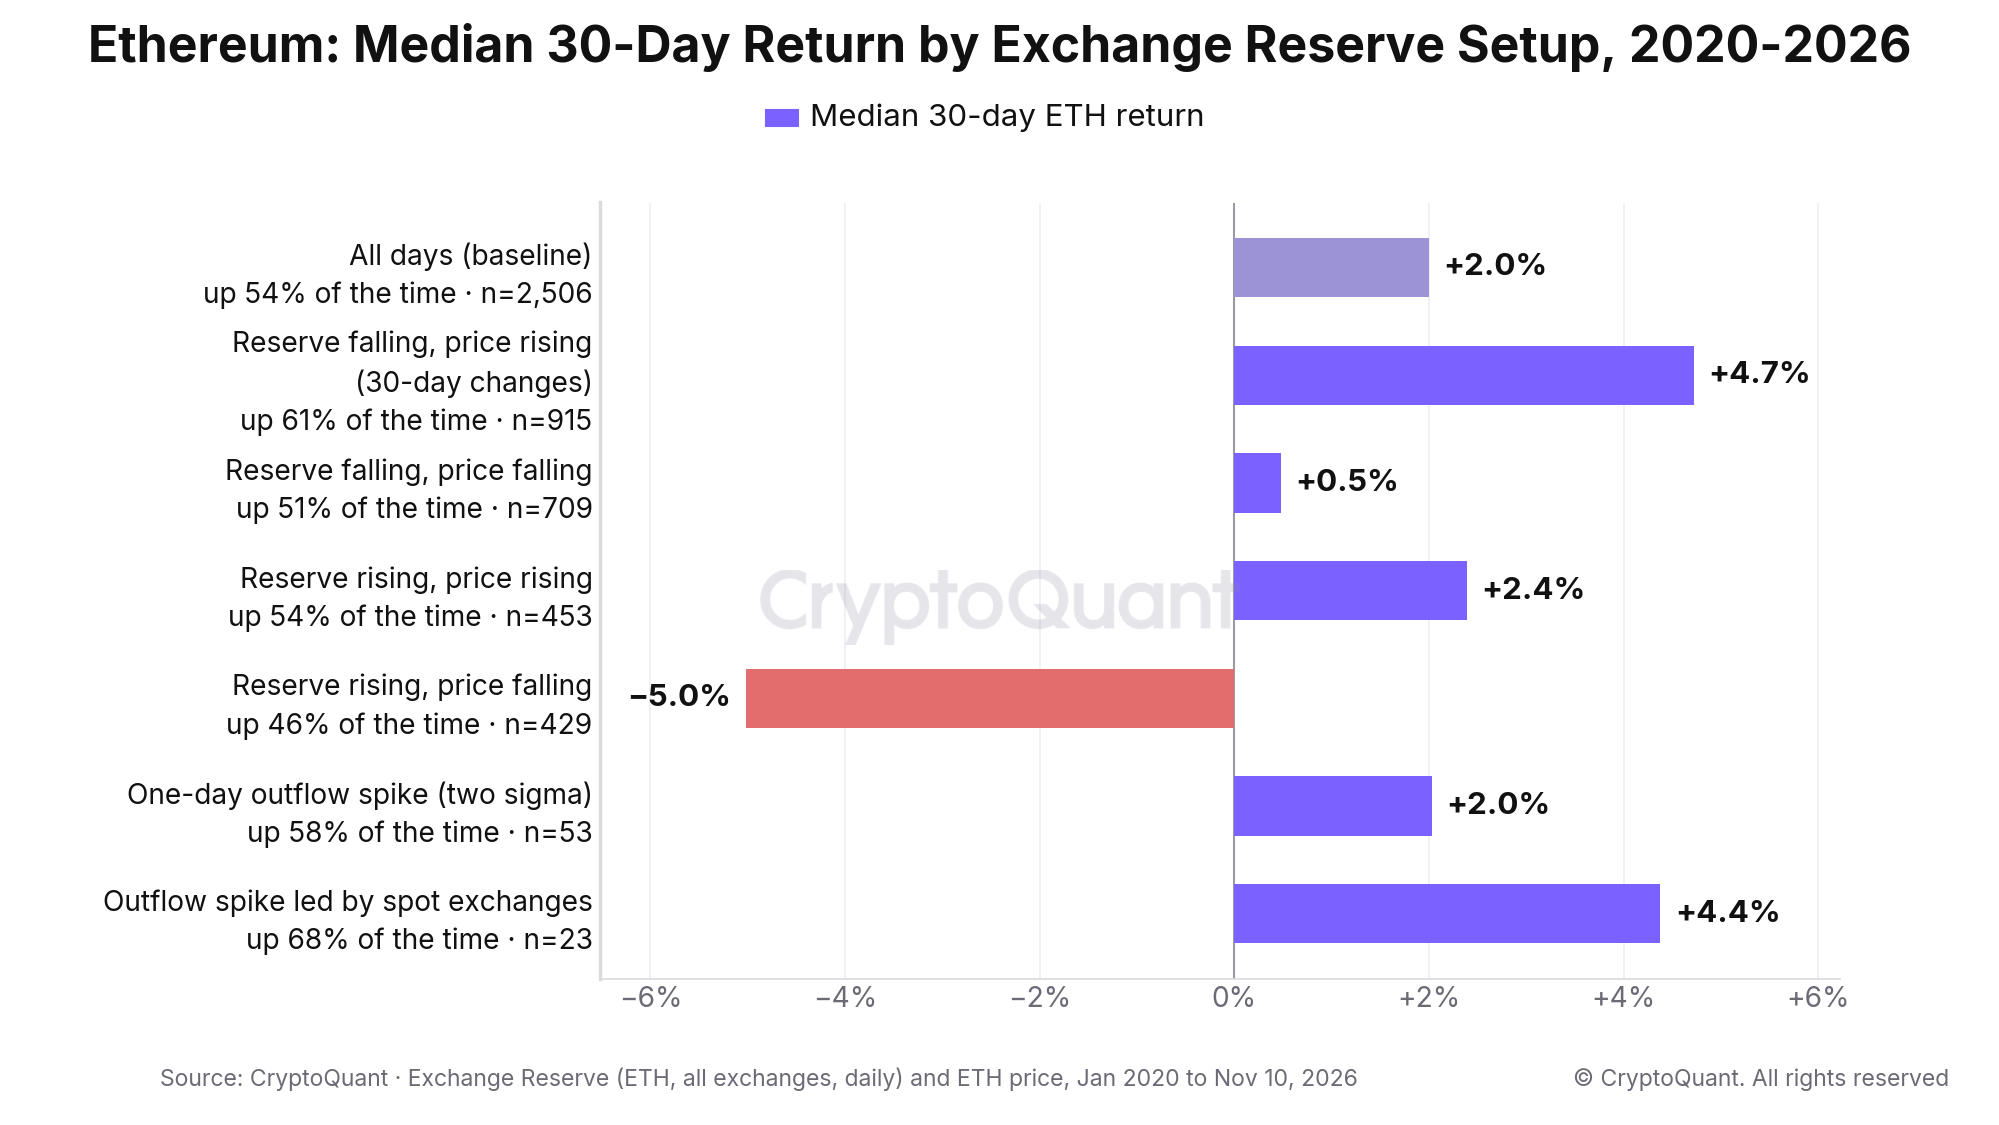
Median 30-day ETH return by exchange reserve setup, January 2020 to November 10, 2026: +4.7% when the reserve fell while price rose, −5.0% when it rose while price fell. Source: CryptoQuant.
How to read a falling ETH exchange reserve
1. Read the 30-day trend together with price
Between July 1 and August 22, 2025, the reserve fell by 1,465,460 ETH, from 21,376,654 to 19,911,194. ETH rose from $2,405 to $4,830 over the same 52 days, a gain of 100.8%. Spot exchanges lost 927,905 ETH and derivative exchanges lost 527,059. That is the one trend row in the table that beat the baseline. It describes the trend, not the top. ETH was 8.0% lower 30 days after August 22.
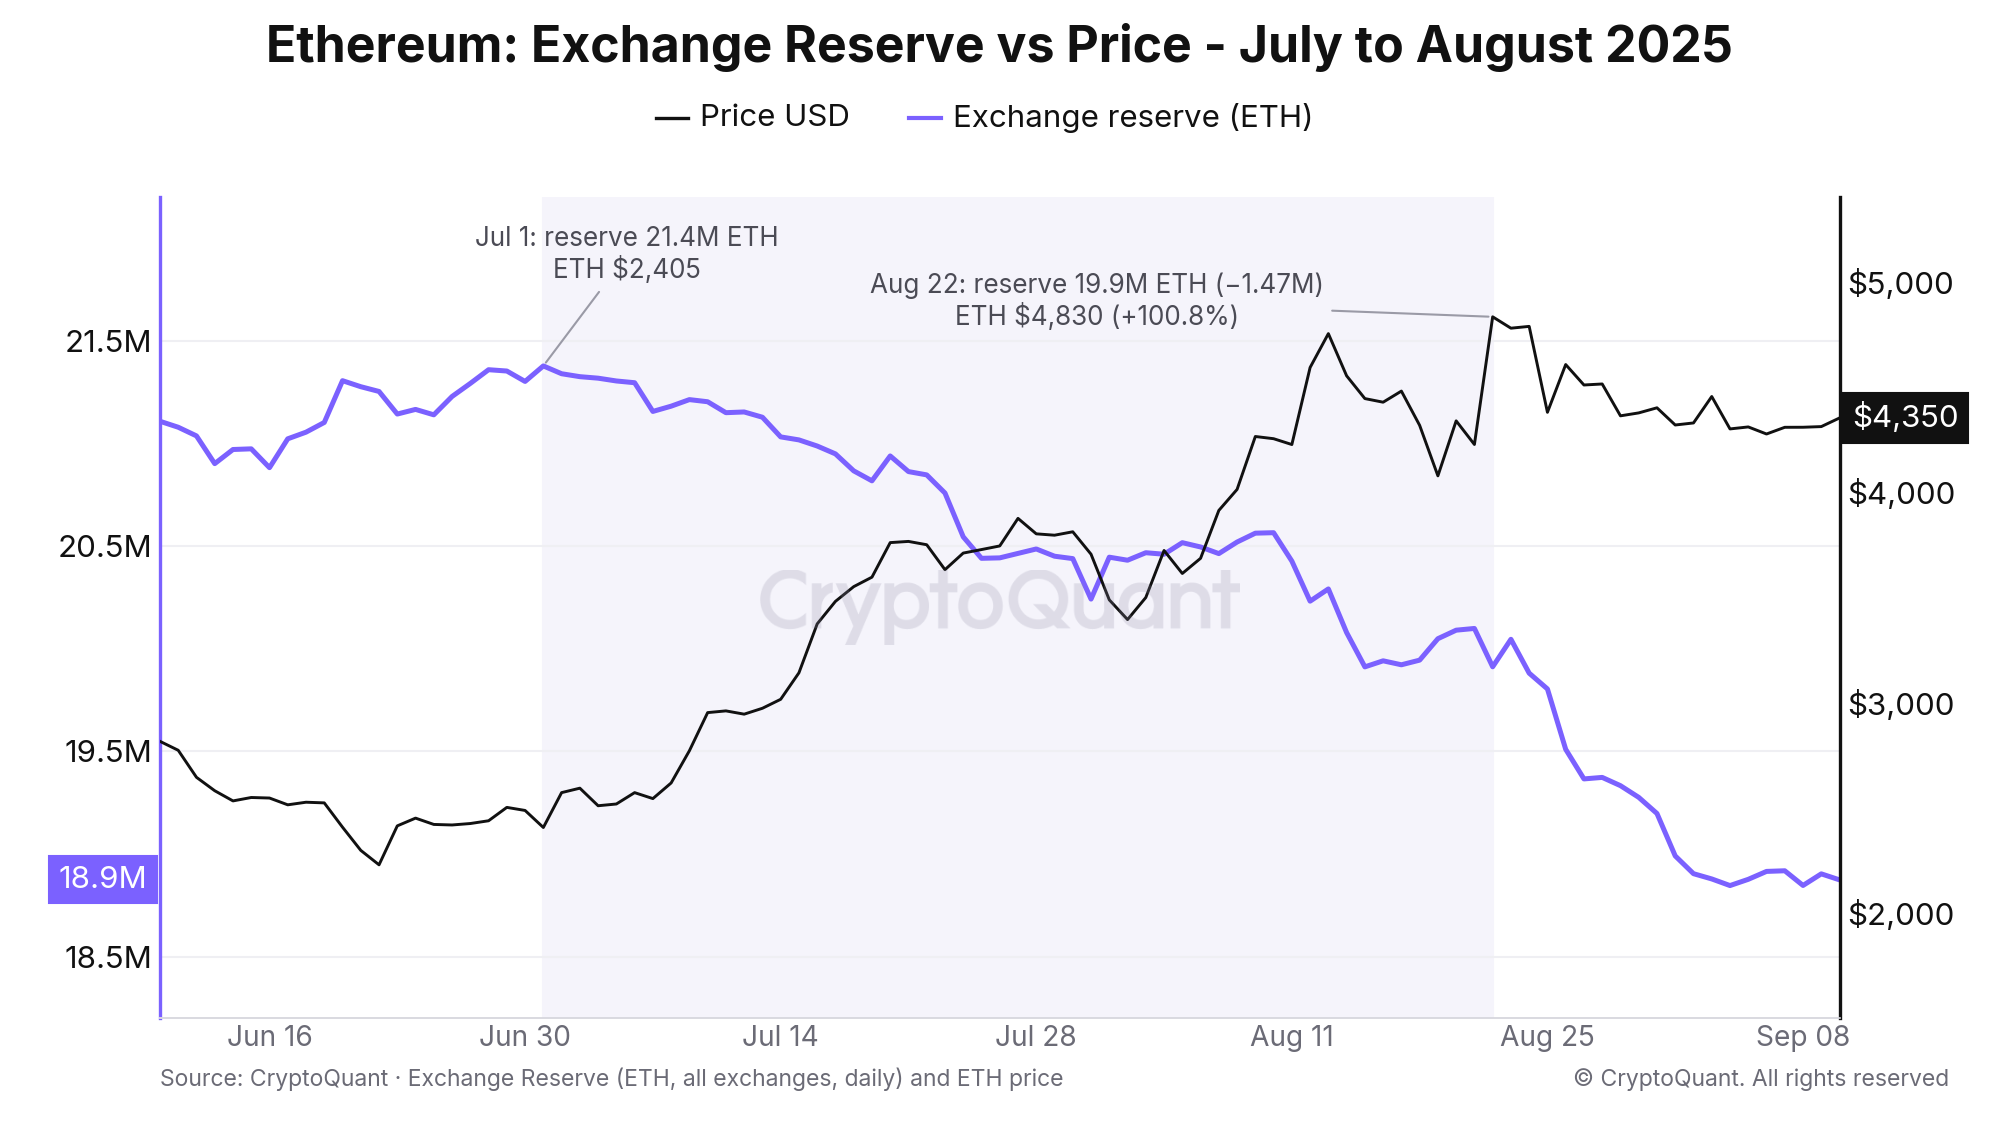
July 1 to August 22, 2025: the Ethereum exchange reserve fell from 21.4 million to 19.9 million ETH while ETH rose 100.8% to $4,830. Source: CryptoQuant.
2. Treat a rising reserve into a falling price as the warning
Between April 21 and May 21, 2026, the reserve rose by 581,693 ETH while ETH fell 8.4%. Derivative exchanges gained 675,663 ETH, and Binance alone went from 3,399,662 to 3,871,223 ETH. Thirty days later ETH was 18.5% lower. The same pattern appeared on June 4, 2022, when the reserve was up 763,542 ETH over 30 days and ETH was down 34.4%. ETH fell another 36.2% over the next 30 days.
3. Trust an outflow spike only if spot exchanges led it and it sticks
On February 21, 2025, the day Bybit reported a security breach, the reserve fell by 457,434 ETH. Derivative exchanges lost 465,357 ETH, and Bybit went from 439,762 to 61,126 ETH. By February 24 Bybit held 381,396 ETH again. ETH was 24.5% lower 30 days later. Compare July 7, 2022. The reserve fell by 648,021 ETH, 90% of it from spot exchanges and 510,915 ETH from Coinbase. ETH was 36.7% higher 30 days later. Across all 53 spikes, the 30 led by derivative exchanges returned a median +0.1% over 30 days. The seven that were more than half reversed within three days returned a median −6.5%.
4. Check which exchange moved before you read the total
The largest one-day drop since 2020 came on July 21, 2022. The reserve fell by 1,491,461 ETH, 5.1% of the total, and Gemini went from 3,180,240 to 1,632,692 ETH. ETH was flat 30 days later and 18.5% lower after 90 days. A move that sits on one exchange is that exchange's story until other venues agree.
When a falling ETH exchange reserve misleads
Staking takes the coins, not buyers. Between August 22, 2025 and June 25, 2026, the reserve fell by 4,264,339 ETH, or 21.4%. ETH fell 67.6% over the same period, from $4,830 to $1,566. Staked ETH rose by 4,122,582 ETH. Coins that leave an exchange for the staking contract are not demand at the market price. The ETH staking rate chart shows that side of the move.
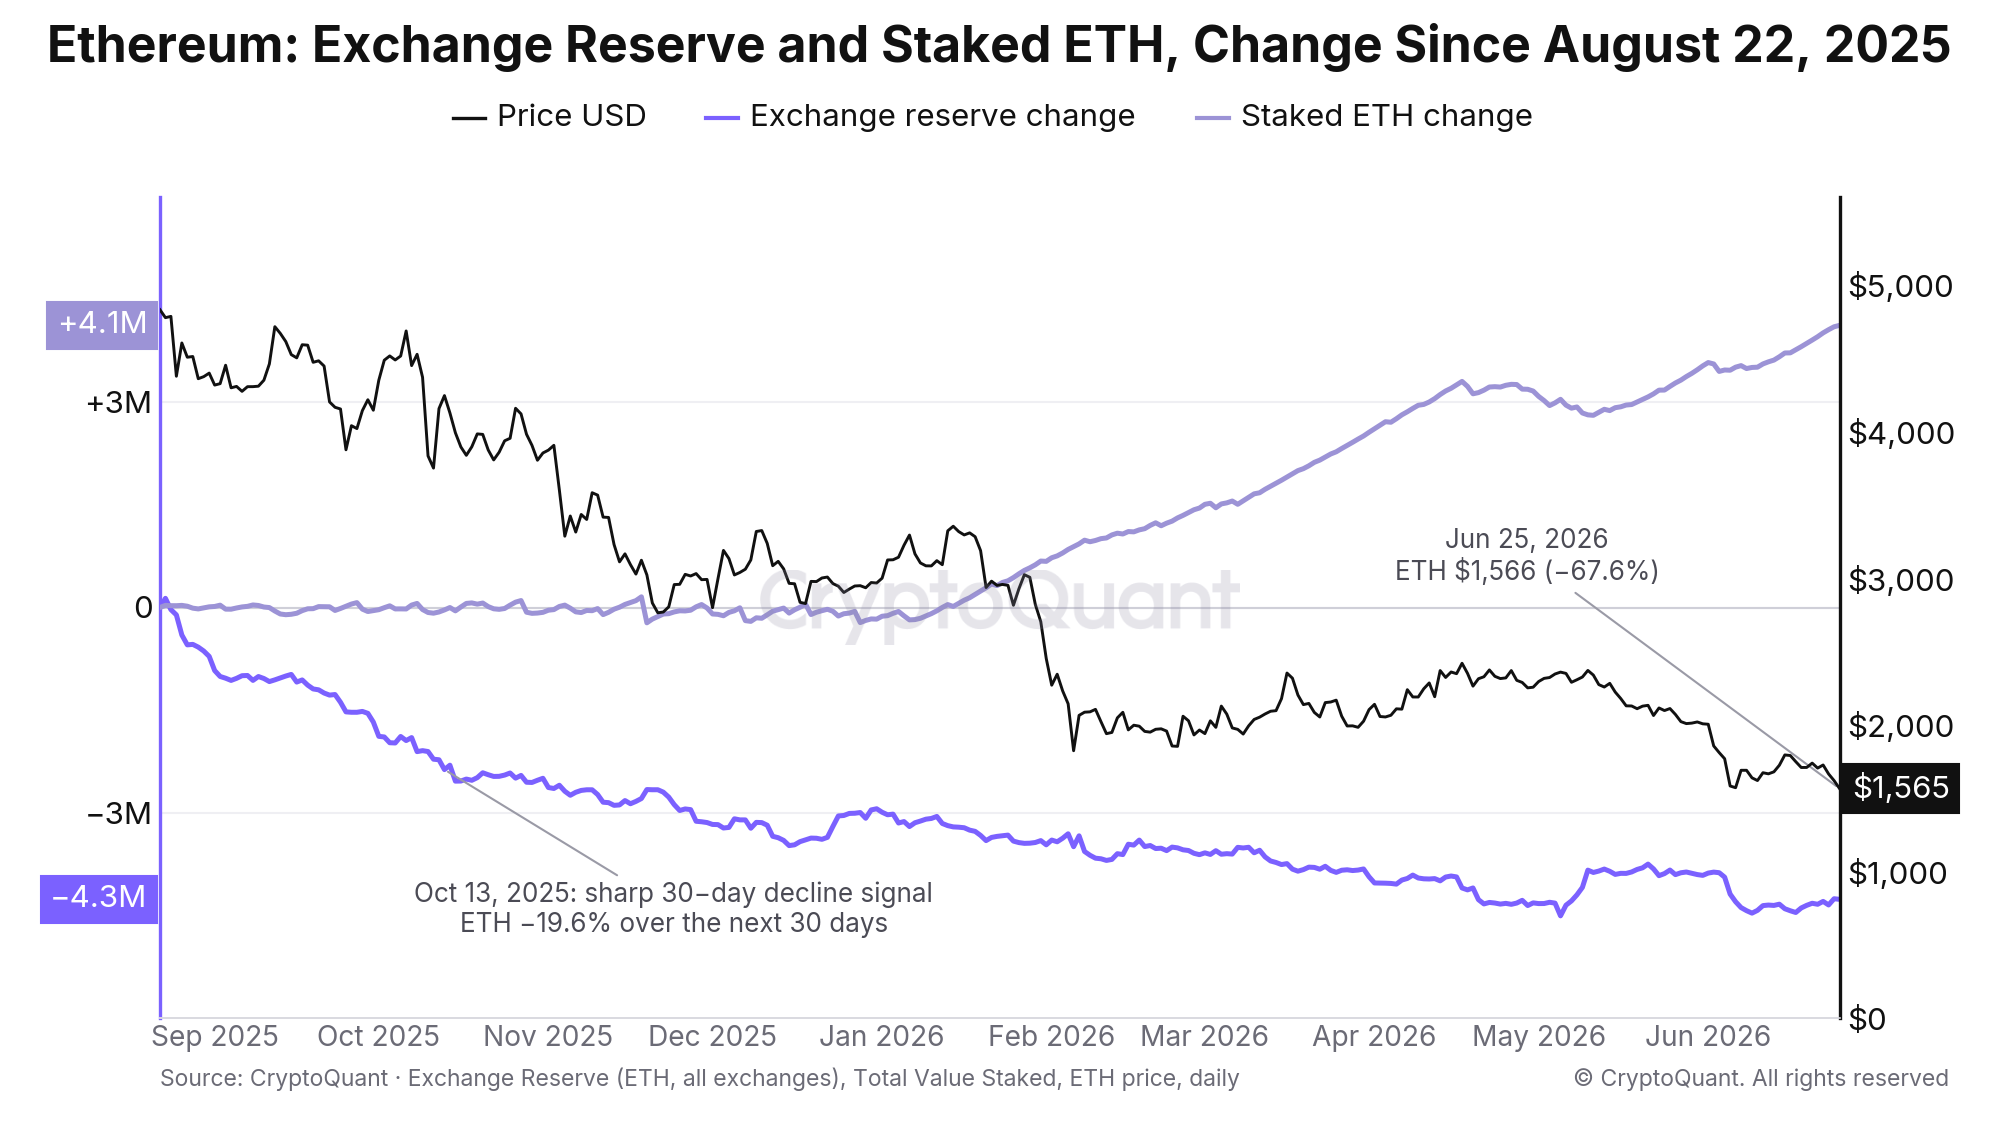
August 22, 2025 to June 25, 2026: the exchange reserve fell by 4.3 million ETH and staked ETH rose by 4.1 million while ETH fell 67.6% to $1,566. Source: CryptoQuant.
Fear withdrawals. Between November 6 and November 25, 2022, during the FTX collapse, the reserve fell by 2,453,331 ETH, or 9.0%. ETH fell 23.5%. Users were moving coins to their own wallets, not accumulating. ETH was 1.6% higher 30 days after November 25.
A sharp decline into a falling price. On October 13, 2025, the 30-day change in reserve was −1,339,275 ETH, beyond two standard deviations. ETH had already fallen 9.1% over those 30 days. It fell another 19.6% over the next 30 days and 26.5% over the next 90. Six of the eight sharp declines since 2020 were followed by a higher price after 30 days. This one was not.
A five-step checklist
1.
Open the ETH exchange reserve chart on the daily window and note the 30-day change. Compare it with the 30-day change in price.
2.
Check the split between spot and derivative exchanges. A drop on derivative exchanges is collateral leaving, so read it with ETH open interest and ETH funding rates. Our funding rates and open interest playbook explains how.
3.
Filter by exchange. If one venue accounts for most of the move, wait for the others.
4.
For a one-day spike, wait three days and see whether it reverses. Our exchange netflow playbook shows which daily flows matter.
5.
Compare the decline with the change in staked ETH over the same period.
What the ETH exchange reserve is saying now
As of November 10, 2026, the reserve is 14,620,265 ETH. It touched 14,500,129 ETH on November 2, 2026, the lowest level since July 2016. Over the last 30 days the reserve fell by 378,977 ETH, or 2.5%, while ETH fell 19.1% from $2,534 to $2,051. That is the "reserve falling, price falling" row, with a median 30-day return of +0.5%. The decline is also narrow. Binance lost 396,827 ETH over those 30 days, and all other exchanges combined gained about 17,900 ETH. The largest single day was October 29, 2026, when the reserve fell by 287,886 ETH, 178,445 of it from Binance, and ETH fell 4.5% to $2,253.
Since the November 2 low the reserve has risen by 120,136 ETH while ETH fell 8.8%. Two levels matter from here. A 30-day change that turns positive while price keeps falling would move ETH into the row with the −5.0% median. A 30-day decline beyond 740,014 ETH, today's two-sigma threshold, would be the ninth sharp decline since 2020.
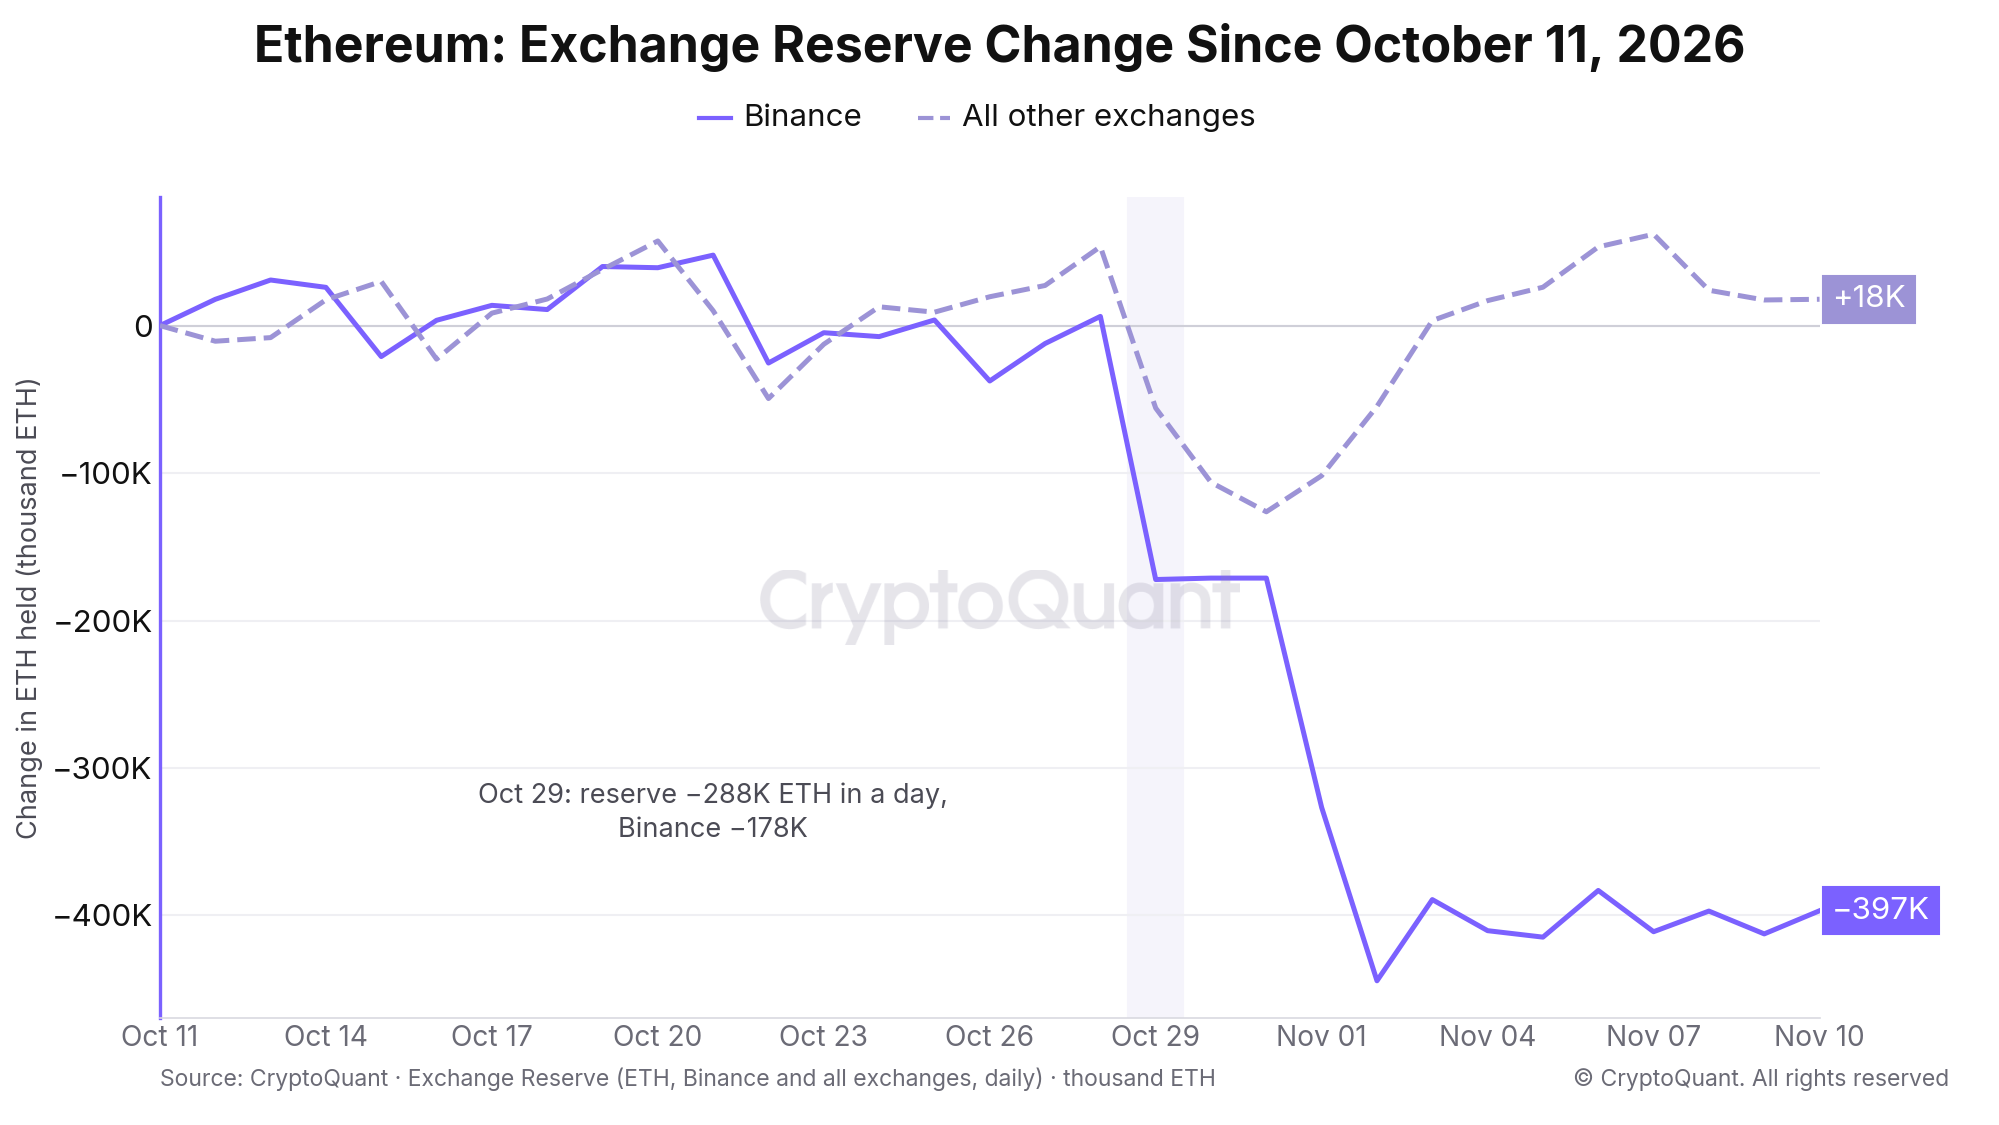
Change in ETH held since October 11, 2026: Binance lost 397,000 ETH by November 10 while all other exchanges combined gained about 18,000 ETH. Source: CryptoQuant.
Track it live
MCP: pull the same series into your agent with CryptoQuant MCP
FAQ
Is a falling ETH exchange reserve bullish?
Not by itself. The reserve was lower than 30 days earlier on 65% of days since 2020, and it fell 21.7% in 2022 while ETH lost 68.3%. It was followed by above-baseline returns only when price was rising too, with a median +4.7% over 30 days against +2.0% for all days.
Why is ETH supply on exchanges falling?
ETH leaves exchanges for self-custody and for staking. Between July 1, 2025 and November 10, 2026, staked ETH rose from 35,564,353 to 44,596,618 while the exchange reserve fell from 21,376,654 to 14,620,265 ETH. The Ethereum exchange reserve chart shows which exchanges lost coins.
What does a rising Ethereum exchange reserve mean?
More ETH is being deposited than withdrawn. When the reserve rose over 30 days while price fell, the median 30-day return since 2020 was −5.0% and 46% of cases closed higher. When it rose alongside price, the median was +2.4%, close to the baseline.
What is the difference between ETH exchange reserve and exchange netflow?
Netflow is the daily difference between deposits and withdrawals. The reserve is the running total of those flows. Use netflow for single days and the reserve for the trend, as our guide to exchange netflow explains.