
Exchange Netflow: When Bitcoin Inflows Actually Matter
CryptoQuant.com
A large Bitcoin exchange inflow is the most quoted on-chain warning sign, and on its own it is close to useless. Since 2020, BTC was no more likely to be down a month after an inflow spike than on any other day. What makes an inflow matter is what happens next: whether the coins stay on the exchange, who sent them, and which kind of exchange received them.
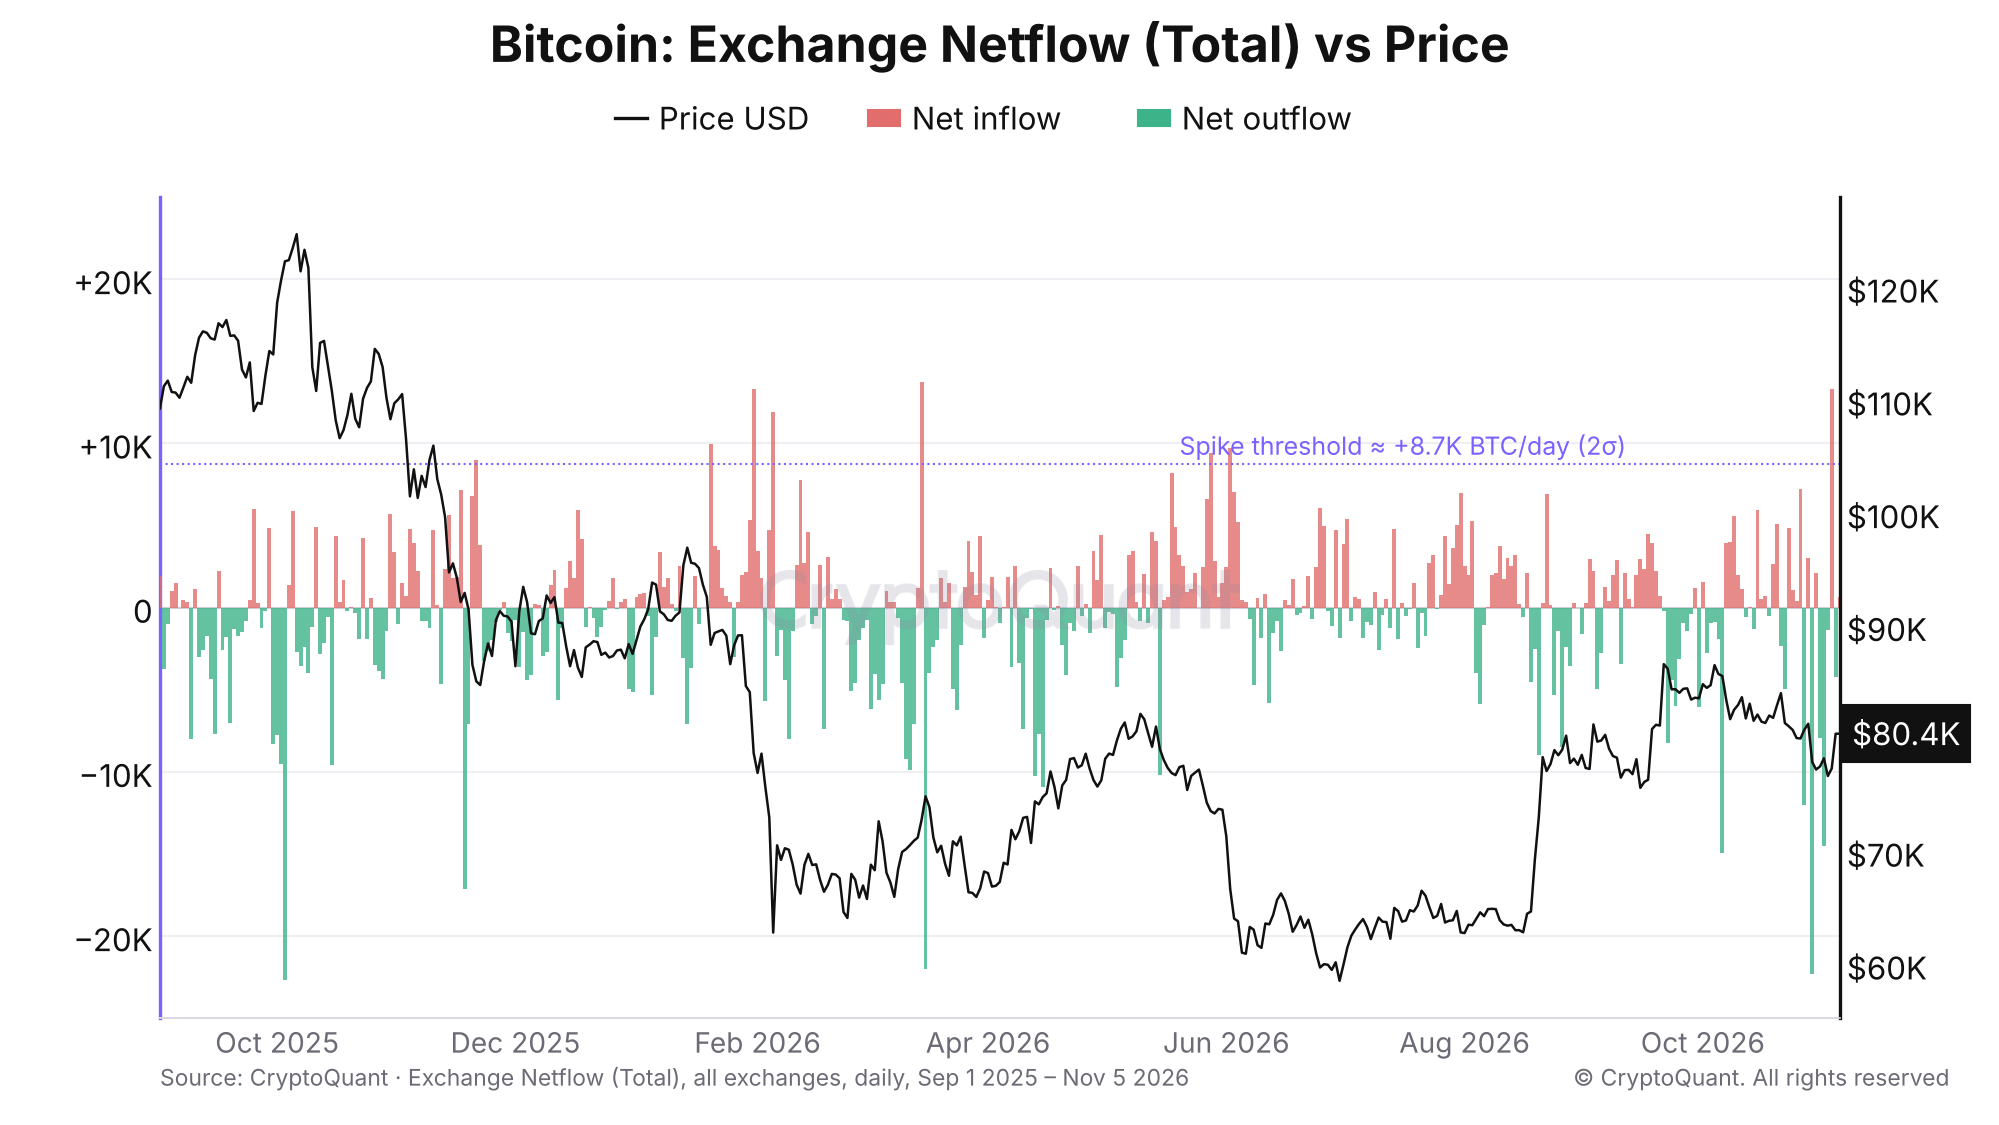
Daily Bitcoin exchange netflow vs price, September 2025 to November 2026. The dotted line marks today's spike threshold of about +8,700 BTC a day.
Bitcoin exchange netflow, explained
Exchange netflow is BTC deposited to exchanges minus BTC withdrawn, per day. Positive means coins arrived; negative means coins left. Add up every day of netflow and you get the exchange reserve: from September 1, 2025 to November 5, 2026, daily netflow summed to −121,000 BTC, and the reserve fell by 122,000 BTC. The full definition is in the exchange in/outflow and netflow guide.
Reserve shows where supply sits. Netflow shows what moved today, which makes it the faster signal and the noisier one.
What counts as an inflow spike
Netflow varies a lot from year to year, so a fixed number doesn't work. A useful definition: a day where netflow exceeds two standard deviations of the past 365 days. Today that threshold is roughly +8,700 BTC in a day. Since January 2020 there have been 41 such spikes, counting clusters within a week as one.
Most inflow spikes don't matter
Across all 41 spikes, BTC was up 30 days later 56% of the time, with a median gain of 0.9%. On an average day over the same period, it was up 56% of the time with a median gain of 2.0%. A raw inflow spike tells you very little.
Split the spikes by what happened next, and the picture changes.
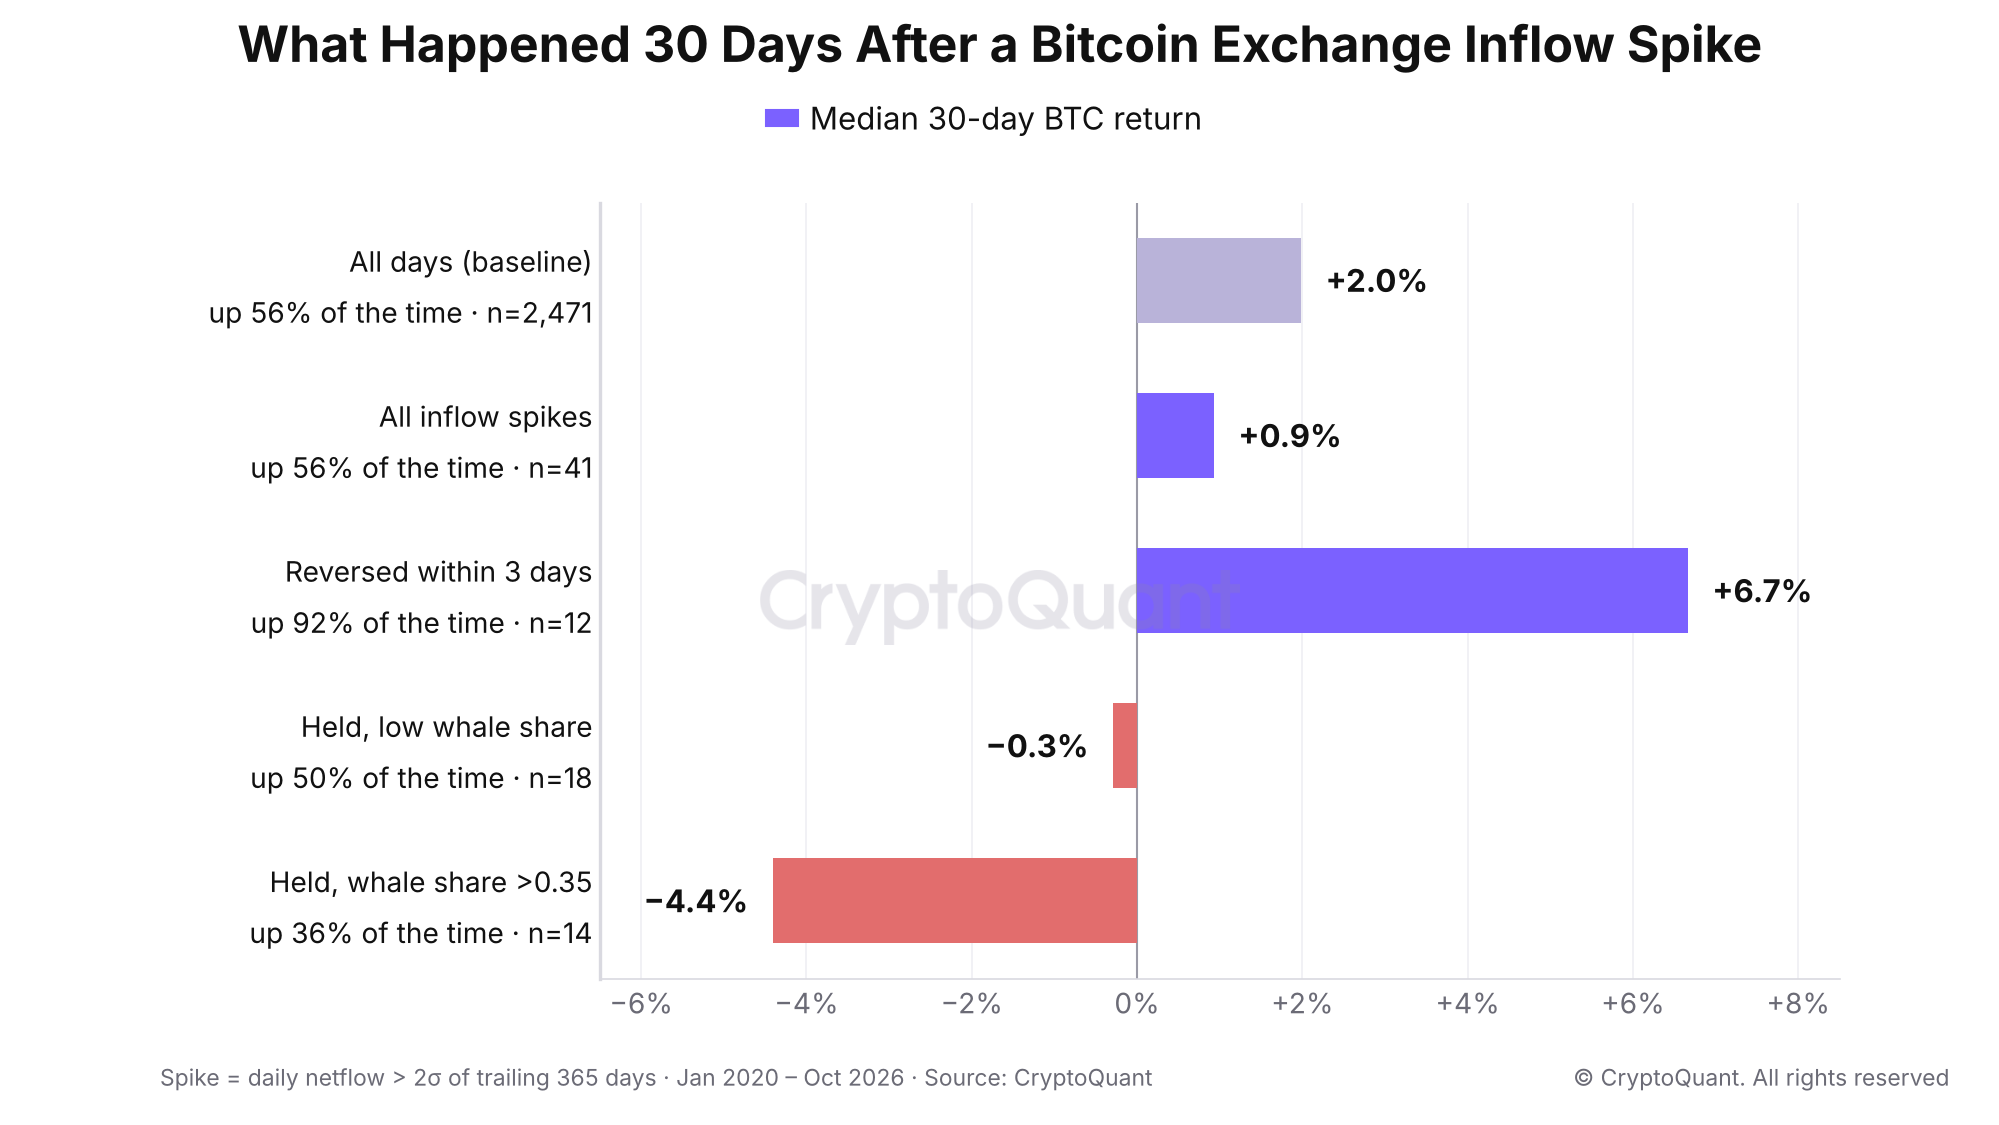
Median BTC return 30 days after an exchange inflow spike, by type of spike, January 2020 to October 2026.
Type of inflow spike | Cases | Up after 30 days | Median 30-day return | Median 90-day return |
|---|---|---|---|---|
All days (baseline) | 2,471 days | 56% | +2.0% | +7.1% |
All inflow spikes | 41 | 56% | +0.9% | +7.4% |
Reversed within 3 days | 12 | 92% | +6.7% | +7.6% |
Held, low whale share | 18 | 50% | −0.3% | +19.1% |
Held, whale share above 0.35 | 14 | 36% | −4.4% | −16.3% |
Three rules come out of this.
1. Ignore inflows that leave within three days
If more than half of a spike flows back out within three days, it was almost certainly coins moving between wallets, not coins being sold. Those 12 cases were followed by gains 92% of the time.
March 2026 is the textbook case. On March 15, 13,700 BTC landed on exchanges. On March 16, 22,000 BTC left. Anyone who read the first day as selling pressure was reading a wallet shuffle.
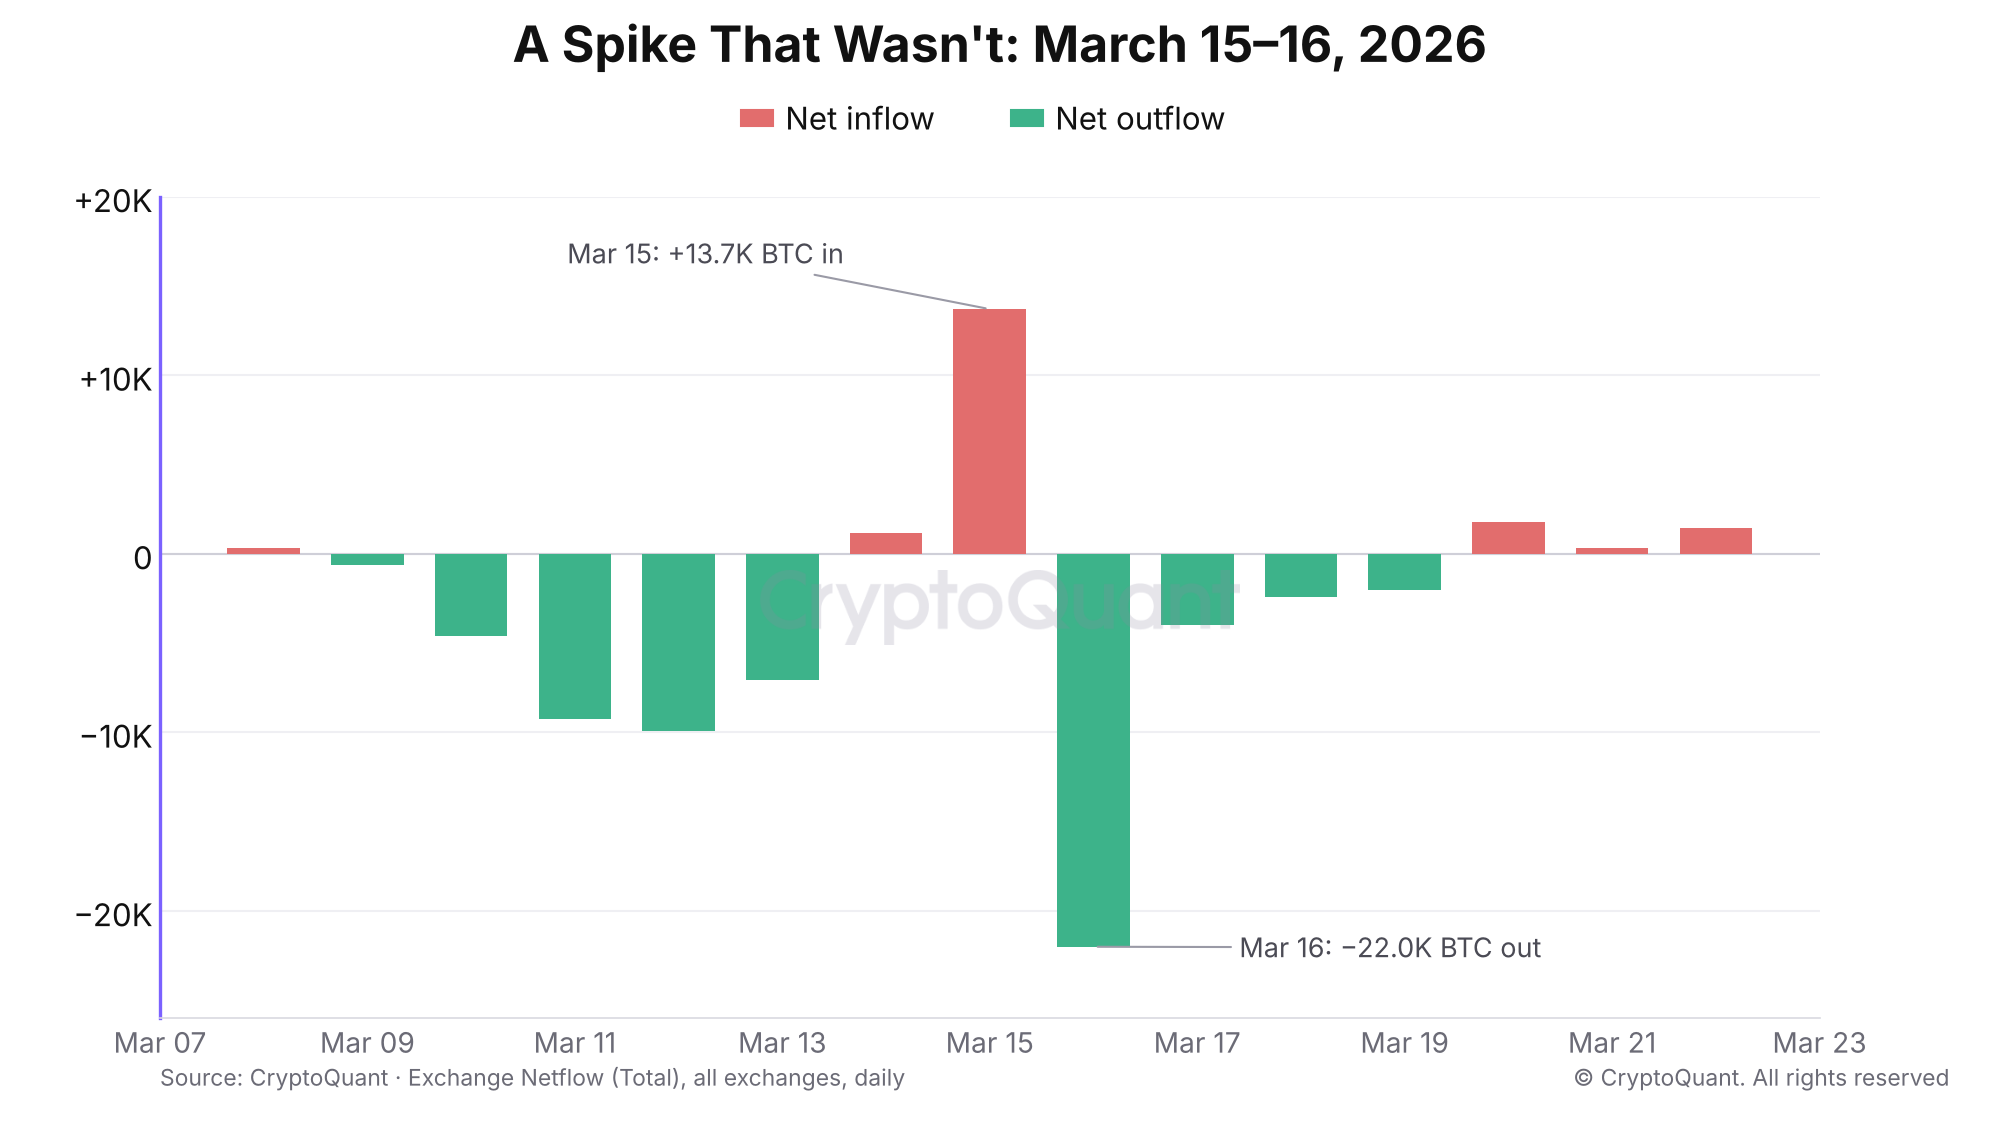
March 15–16, 2026: a 13,700 BTC inflow followed by a 22,000 BTC outflow the next day.
The practical rule: never act on a single day of netflow. Wait for day two and day three.
2. Check who sent the coins
The exchange whale ratio measures how much of the day's inflow came from the 10 largest deposits. Its long-run median is about 0.19. When a spike held and the whale ratio was above 0.35, BTC was up a month later only 36% of the time, and the median 90-day return was −16.3%.
The worst outcomes in the sample sit here:
April 29, 2021: +37,100 BTC, whale ratio 0.55. BTC fell 35% over the next 30 days.
March 22, 2022: +53,800 BTC, whale ratio 0.61. BTC fell 52% over the next 90 days.
November 4, 2022: +103,300 BTC, whale ratio 0.59, the largest inflow day in the dataset. BTC fell 19% in a week as FTX collapsed.
It isn't a perfect signal. On July 17, 2021, a 45,200 BTC inflow with a whale ratio of 0.64 was followed by a 46% rally. Whale-heavy inflows raise the risk; they don't guarantee a drop.
3. Check where the coins went, and what price did first
Coins sent to spot exchanges can be sold for cash. Coins sent to derivatives exchanges are often collateral for futures positions. Use the exchange filter on the netflow chart to split the two. Across the sample, spot-led spikes had a median 30-day return of −0.9%; derivatives-led spikes had +0.9%.
Context matters as much as venue. The spikes that marked bottoms came after price had already crashed, with low whale participation:
March 13, 2020: +49,900 BTC after a 39% weekly drop, whale ratio 0.12. BTC rose 23% in 30 days.
February 5, 2026: +11,900 BTC as price fell 14% in a day to $62,800, whale ratio 0.16. BTC was 12% higher the next day and 7% higher a month later.
The February spike was also derivatives-led: 15,000 BTC went to derivatives exchanges while spot exchanges saw 3,100 BTC leave. That looks like traders posting margin into a liquidation cascade, not holders selling.
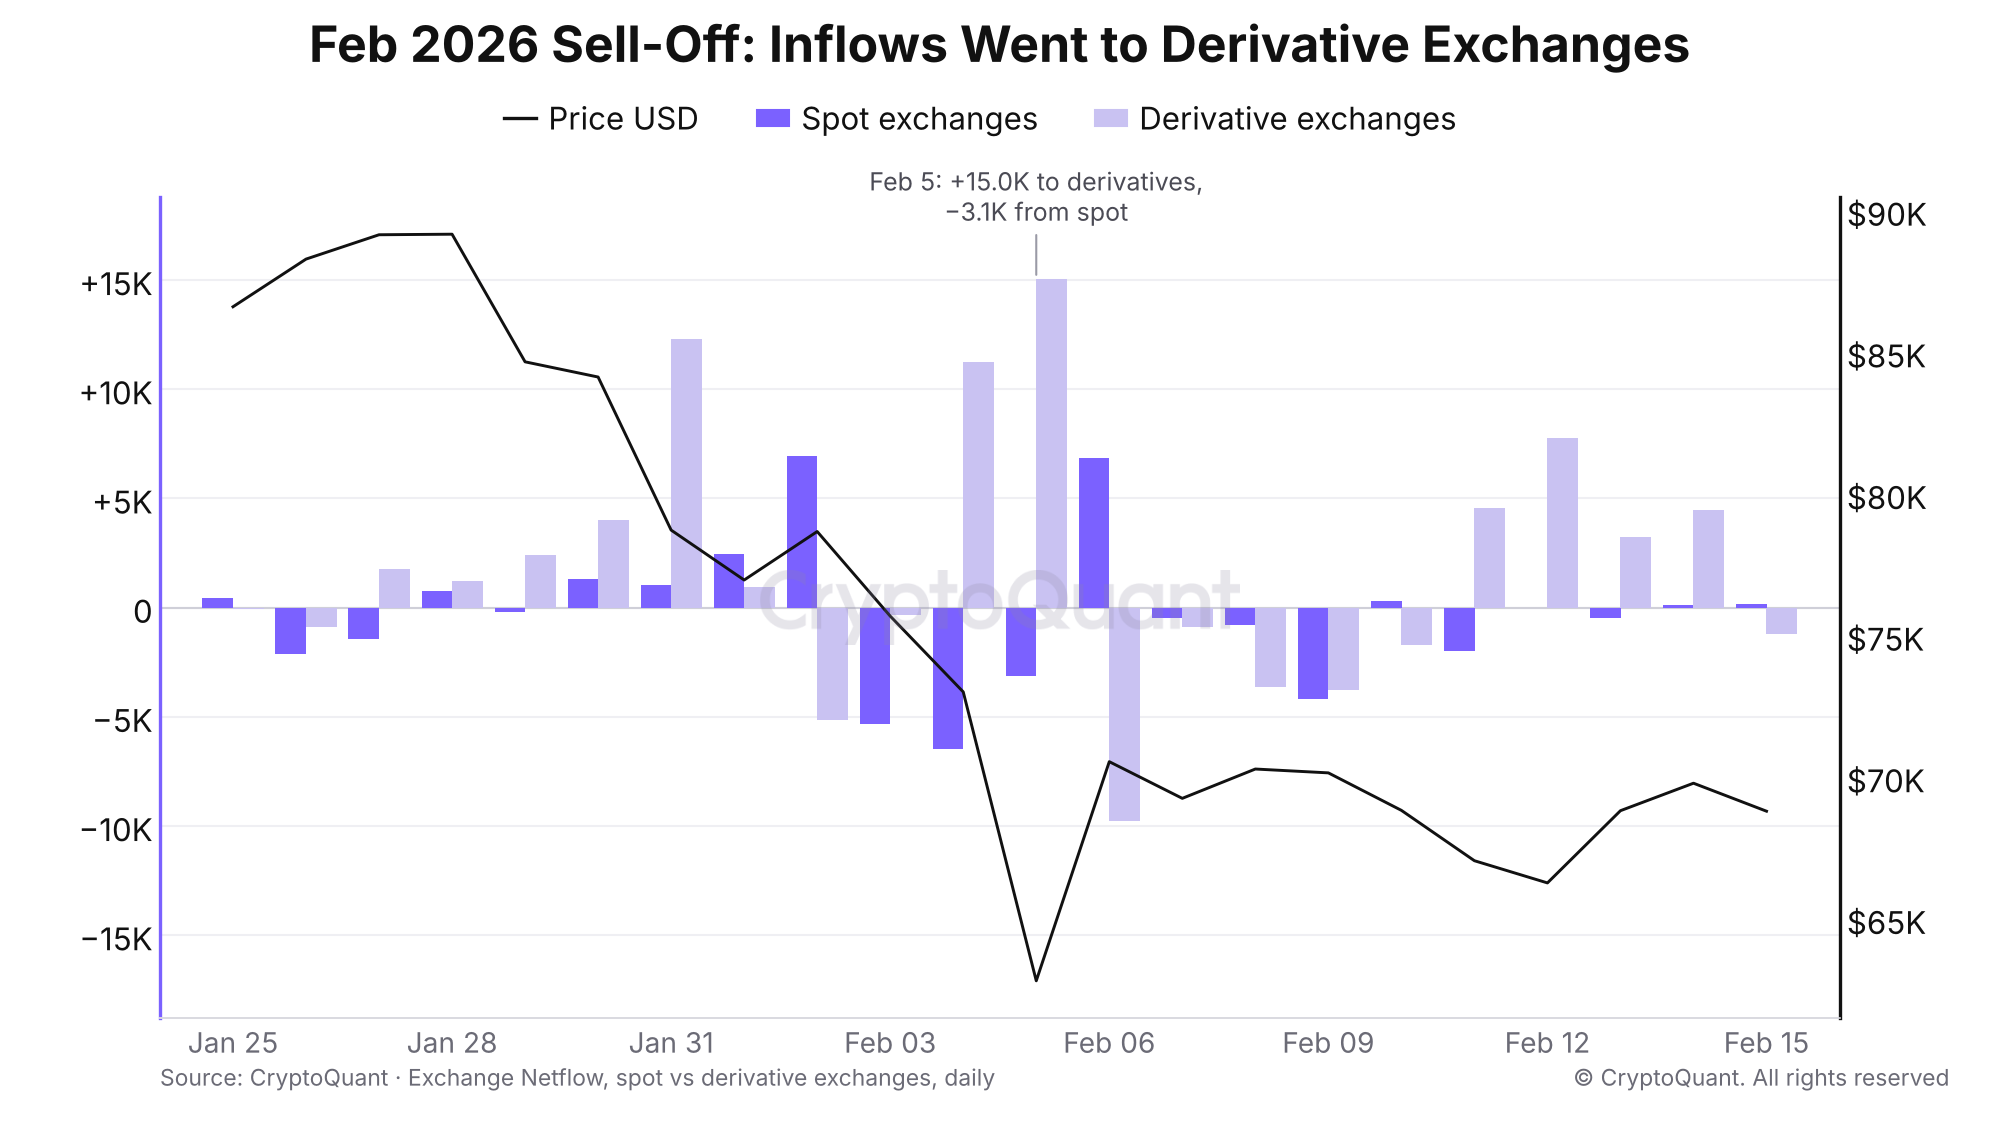
During the February 2026 sell-off, inflows went to derivatives exchanges while spot exchanges saw net outflows.
A checklist for reading an inflow spike
1.
Is it a spike? Compare it with the past year, not a fixed number. Today's bar is about +8,700 BTC a day.
2.
Did it hold? If more than half left within three days, ignore it.
3.
4.
Where did it go? Spot-led is more likely to be sale supply; derivatives-led is often collateral.
5.
What did price do first? A spike after a crash is often capitulation. A whale-heavy spike after a rally or a quiet week is the one to respect.
What netflow is saying
Late October 2026 was dominated by outflows, almost all from derivatives exchanges: −13,700 BTC on October 27, −21,300 BTC on October 29 and −17,100 BTC on November 1. Then on November 3, 13,300 BTC flowed in, again almost entirely to derivatives venues, with a whale ratio of 0.41.
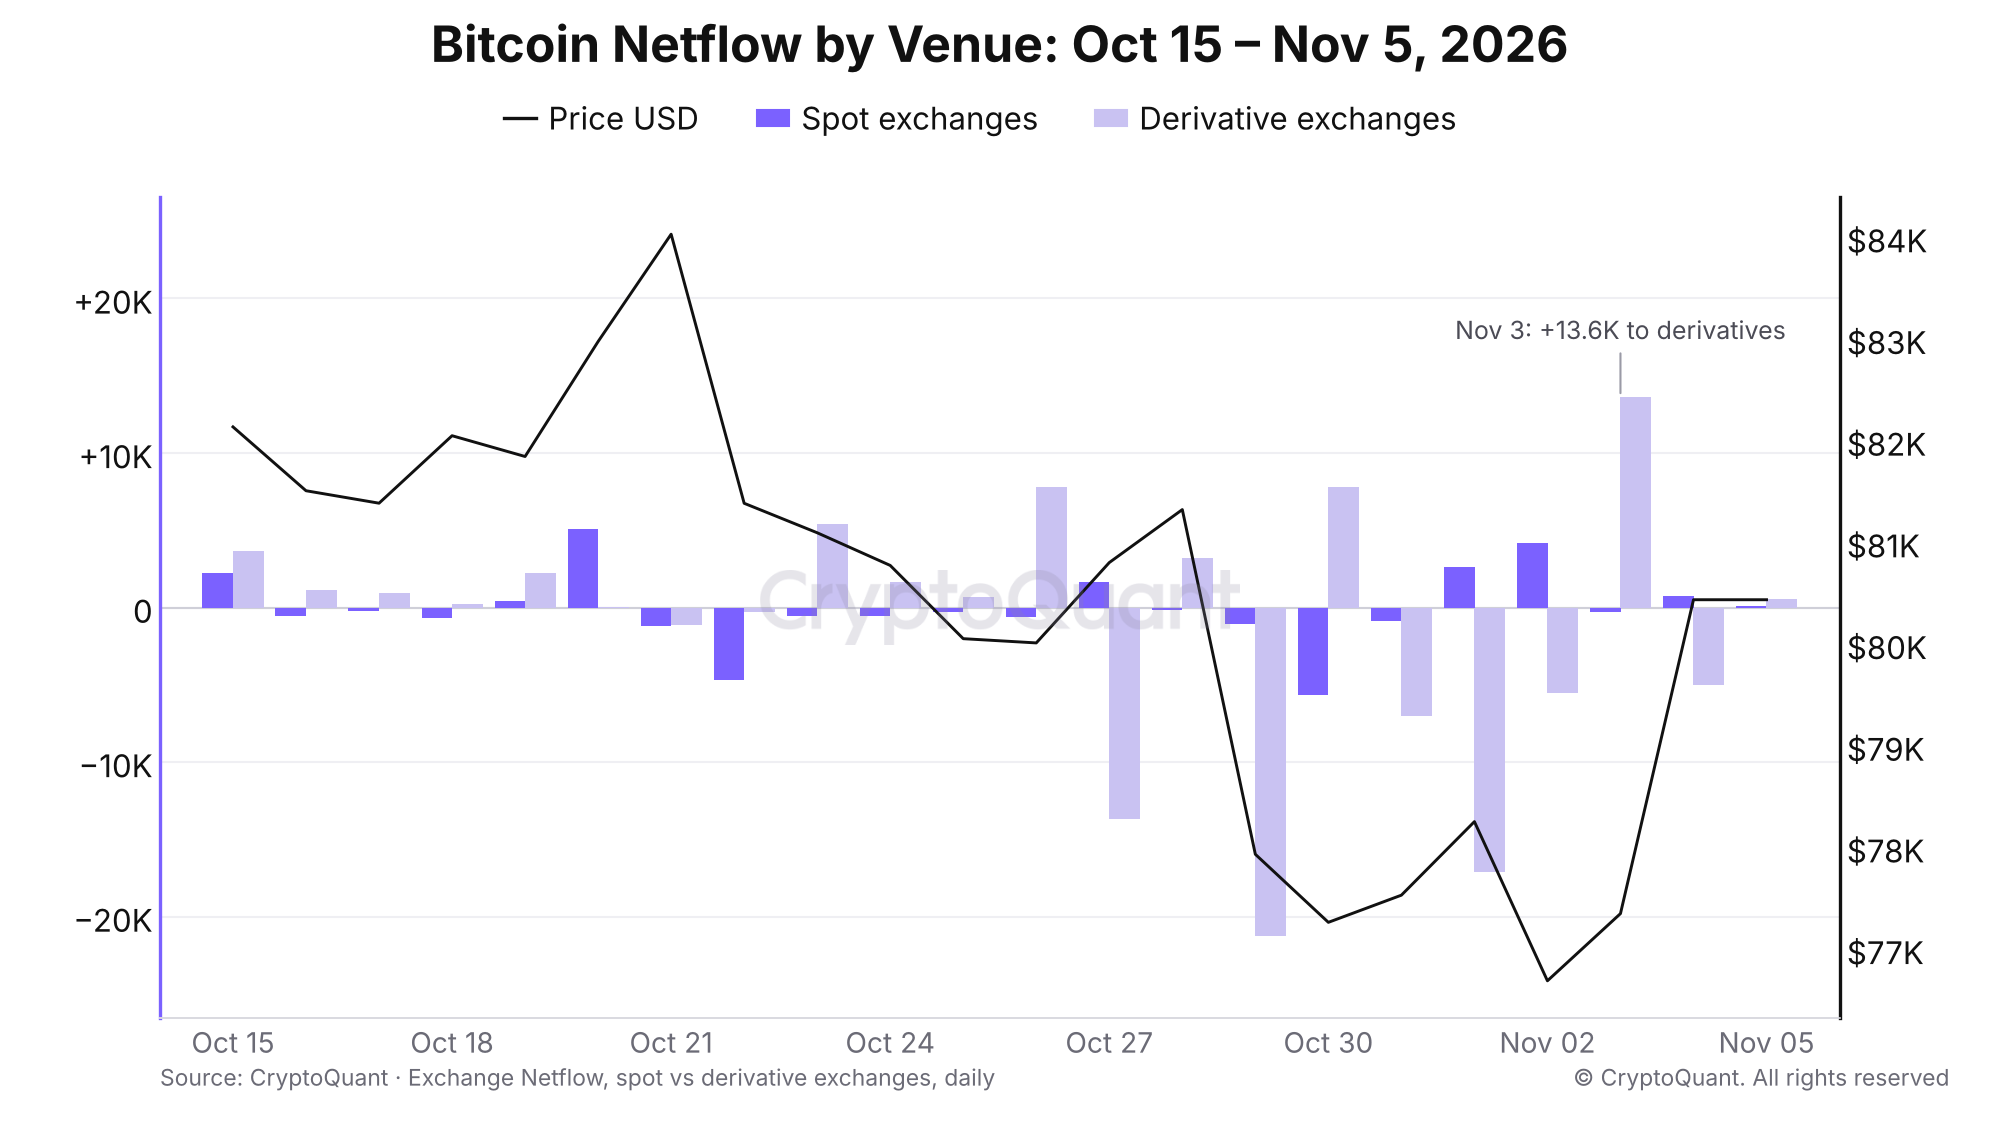
Bitcoin netflow by venue, October 15 to November 5, 2026. The November 3 inflow went to derivatives exchanges.
By the checklist, that spike clears the size bar and the whale bar. But 4,200 BTC left the next day, and spot exchanges saw almost no net change. The thing to watch is rule 2: if the rest of it doesn't leave in the next few days, it's the kind of inflow that has mattered in the past.
For the slower, cumulative view of the same flows, see our guide on how to read Bitcoin exchange reserve.
Track it live
Set an alert on the Bitcoin exchange netflow chart for days above your spike threshold, and pair it with the exchange whale ratio. To run this backtest yourself, pull netflow by exchange type through the CryptoQuant API (endpoint: /v1/btc/exchange-flows/netflow, with exchange set to spot_exchange or derivative_exchange).
For the derivatives side of the same sell-offs, read Bitcoin funding rates and open interest: how to read a leverage flush.
For the whale ratio as a signal in its own right, read Bitcoin whale ratio: tracking large exchange deposits.
FAQ
What does Bitcoin exchange netflow mean?
It's the BTC deposited to exchanges minus the BTC withdrawn over a period, usually a day. Positive netflow means more coins arrived than left. Over time, netflow adds up to the change in exchange reserve.
Are large exchange inflows bearish?
Not on their own. Since 2020, BTC performed about the same after inflow spikes as on an average day. Inflows have been bearish when they stay on exchanges, come mainly from a few large deposits, and arrive without a prior crash.
What's the difference between exchange netflow and exchange reserve?
Netflow is the daily change. Reserve is the running total. Use netflow to spot individual events and reserve to see the trend.
Why do some huge inflows reverse the next day?
Exchanges move coins between their own wallets, and custodians move funds for clients. Those transfers can show up as a deposit one day and a withdrawal the next. A spike that reverses within three days is usually one of these.
What is the exchange whale ratio?
It's the share of total exchange inflow that comes from the 10 largest deposits. A high ratio means a few large holders are sending coins to exchanges, rather than many smaller ones.