
Bitcoin Funding Rates and Open Interest: How to Read a Leverage Flush
CQ Insights
Bitcoin funding rates show who is paying to hold leverage. Open interest shows how much leverage is out there. Read together, they mark the days when crowded longs get wiped out. Since 2020, a leverage flush that followed a week of elevated funding returned a median +3.9% over the next 30 days, against +1.7% for all days.
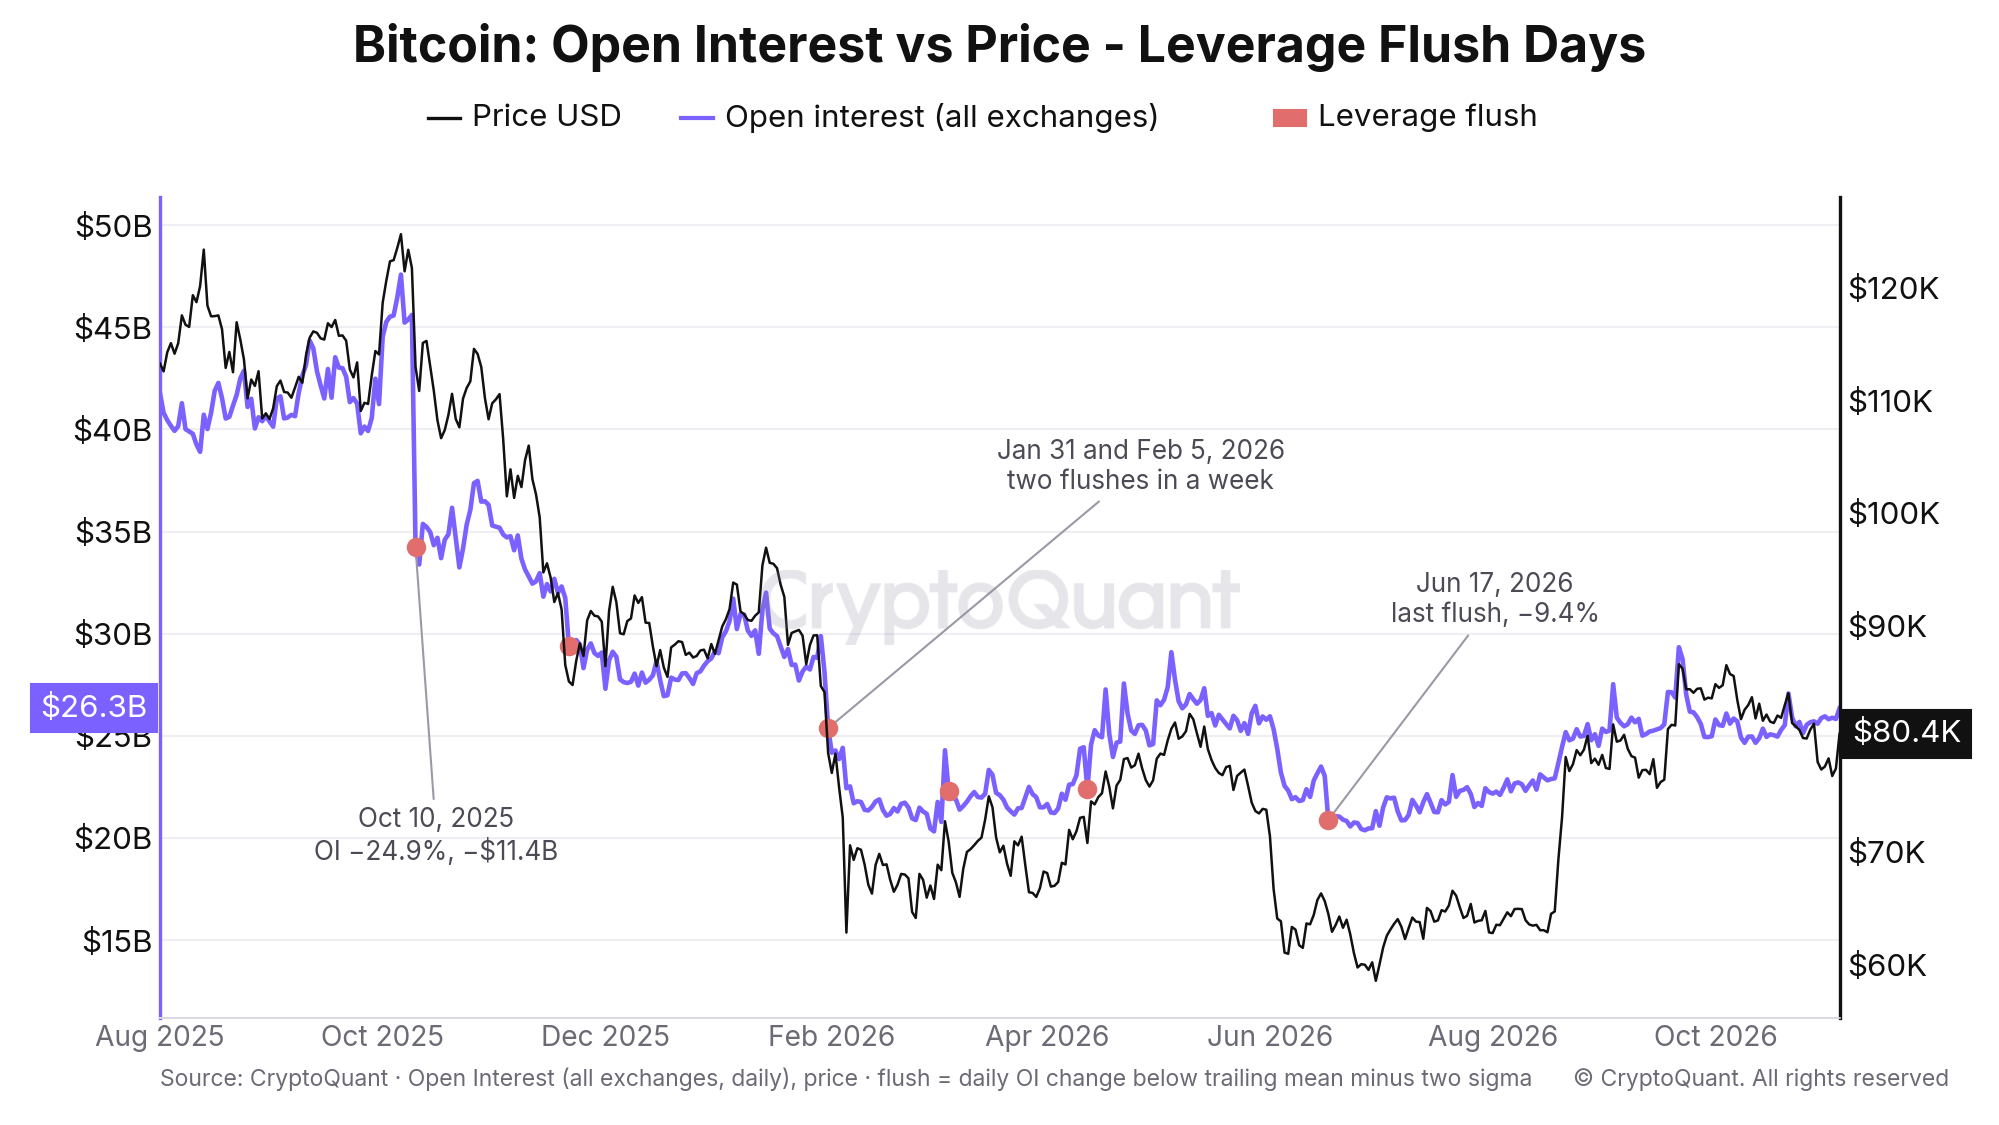
Bitcoin open interest (purple) against price (black), with the two-sigma leverage flush days marked. Source: CryptoQuant.
Funding rates and open interest, explained
A perpetual futures contract never expires, so exchanges use a funding payment to keep its price close to spot. When the perp trades above spot, longs pay shorts. When it trades below, shorts pay longs. CryptoQuant's Bitcoin funding rates chart shows the daily average across major exchanges. Since 2020 the median daily print is 0.0059%, and the rate has been negative on 18% of days. A reading above 0.037% sits in the top 5% of history. The funding rates user guide covers the calculation.
Bitcoin open interest is the dollar value of futures and perpetual contracts still open. It rises when traders add positions and falls when positions close, by choice or by liquidation. A single-day drop of 15% or more almost always means forced closing. We call that a leverage flush. Funding tells you which side was crowded before the flush. That is the part that matters for what comes next.
What the backtest shows
The test uses all-exchange daily open interest, funding rates and price from January 1, 2020 to November 4, 2026. A leverage flush is a day when open interest falls by more than two standard deviations below its trailing 365-day mean daily change. At today's levels that threshold is a drop of about 5.9%, or roughly $1.5 billion. Flushes within seven days of each other count once. That gives 45 events. "Crowded longs" means the average funding rate over the seven days before the flush was above 0.01%. Returns are measured from the flush day's close, and the median is reported with the share of events that closed higher.
Setup | Events | 30-day median | Up after 30 days | 90-day median | Up after 90 days |
|---|---|---|---|---|---|
All days (baseline) | 2,379 | +1.7% | 55% | +7.1% | 58% |
Leverage flush, any funding | 45 | +0.8% | 53% | +13.6% | 64% |
Flush after crowded longs (7-day funding above 0.01%) | 17 | +3.9% | 65% | +21.7% | 71% |
Flush with funding at or below 0.01% | 28 | −1.3% | 46% | +12.3% | 61% |
Open interest build-up (daily rise above two sigma) | 53 | −1.6% | 42% | +5.9% | 56% |
Funding above two sigma (extreme longs) | 15 | +14.1% | 80% | +18.9% | 71% |
Two things stand out. A flush on its own carries no 30-day edge. The median return is below the baseline. A flush that follows crowded longs does better on every horizon, including a +3.4% median after seven days with 71% of events higher, against +0.4% and 53% for all days. Seventeen events is a small sample, so treat these as tendencies rather than rules.
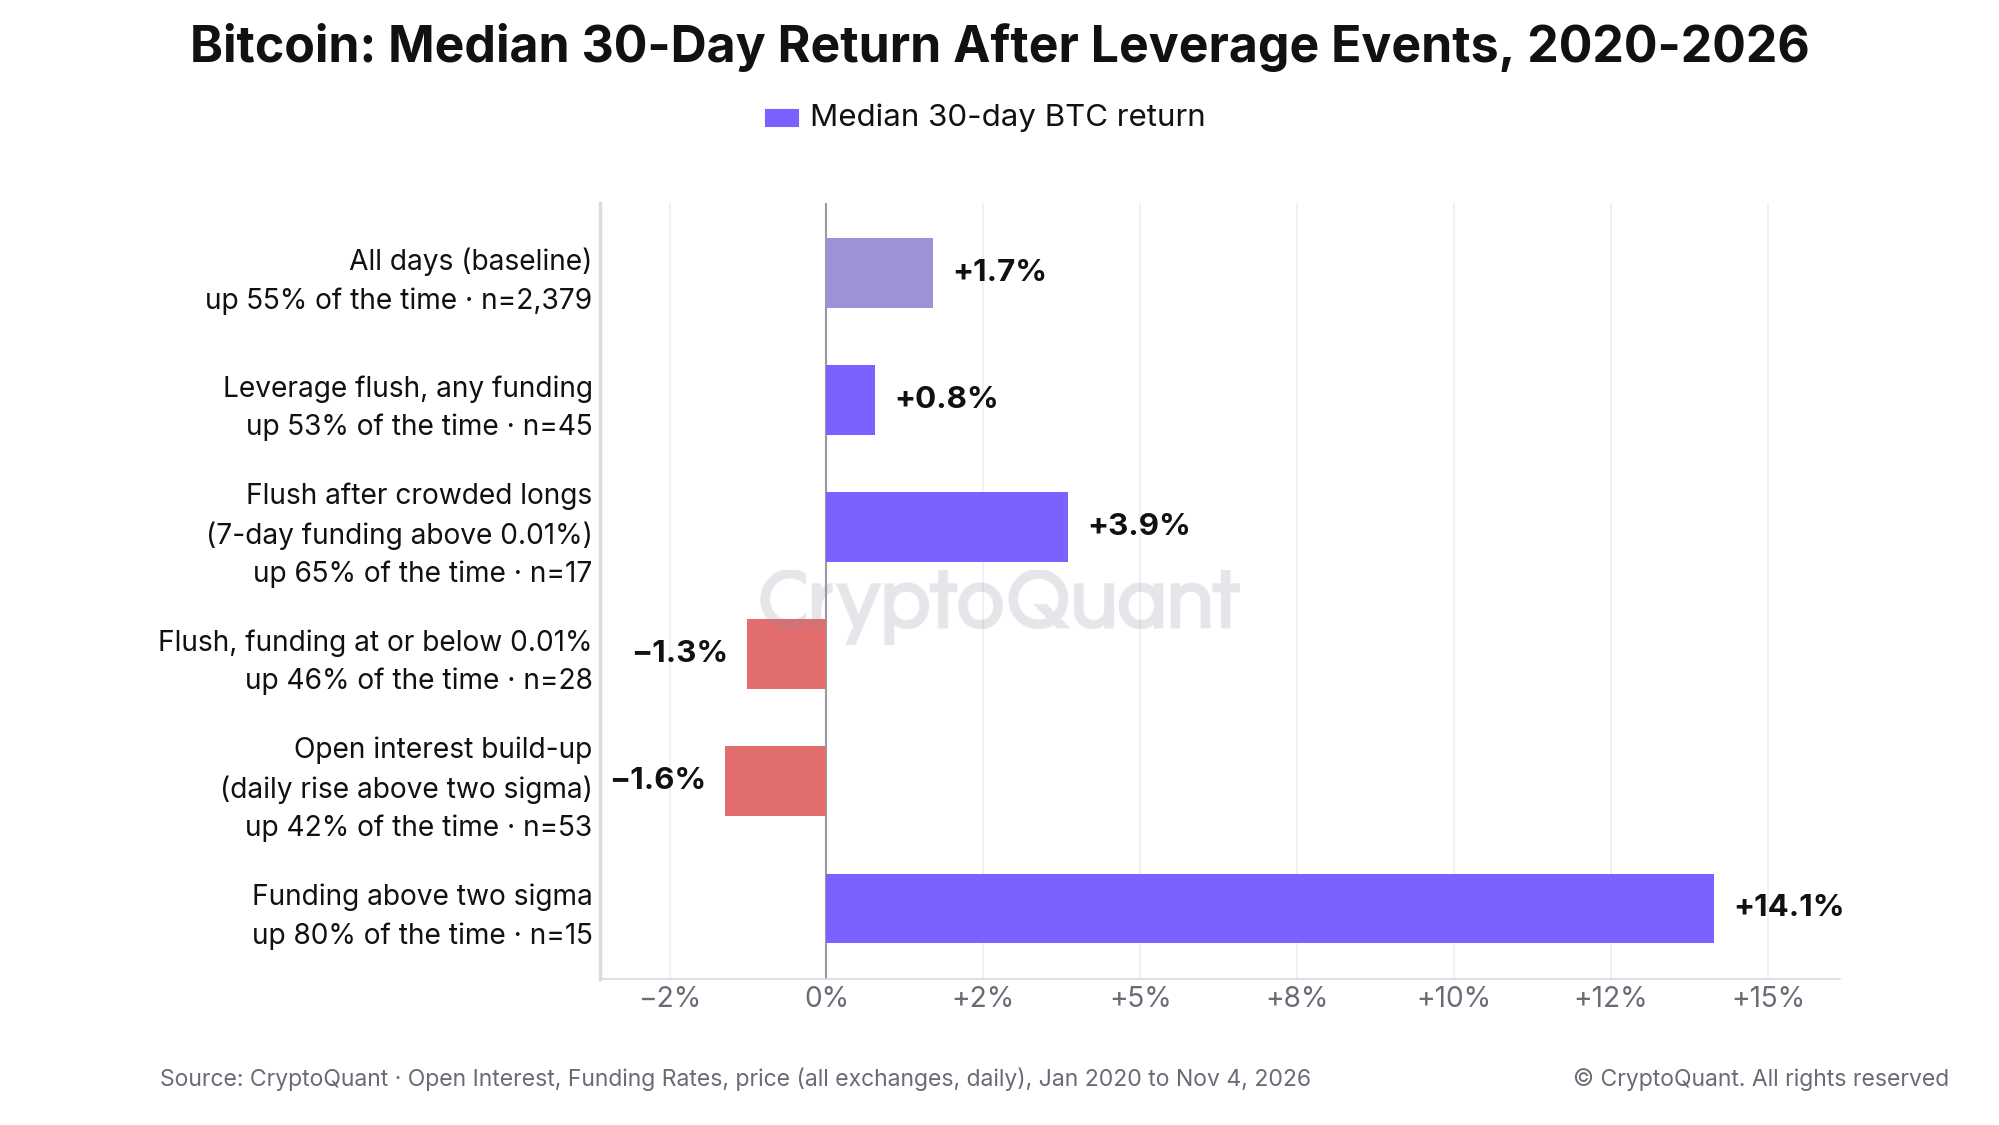
Median 30-day Bitcoin return after each setup, 2020 to 2026. Source: CryptoQuant.
How to read a leverage flush
1. Check who was paying before the flush
The funding rate in the week before the flush does most of the work. On August 5, 2024, the seven-day average funding rate was 0.0104%. Open interest fell 18.6% in a day, from $16.7 billion to $13.6 billion, while Bitcoin closed at $54,019, down 7.1%. Three days later it closed at $61,698. The 90-day return was +27.3%. Compare June 13, 2022. Open interest fell 21.4% that day, a bigger flush in percentage terms, but the seven-day funding average was 0.0014%. Nobody was crowded. Bitcoin fell another 9.9% over the next 30 days.
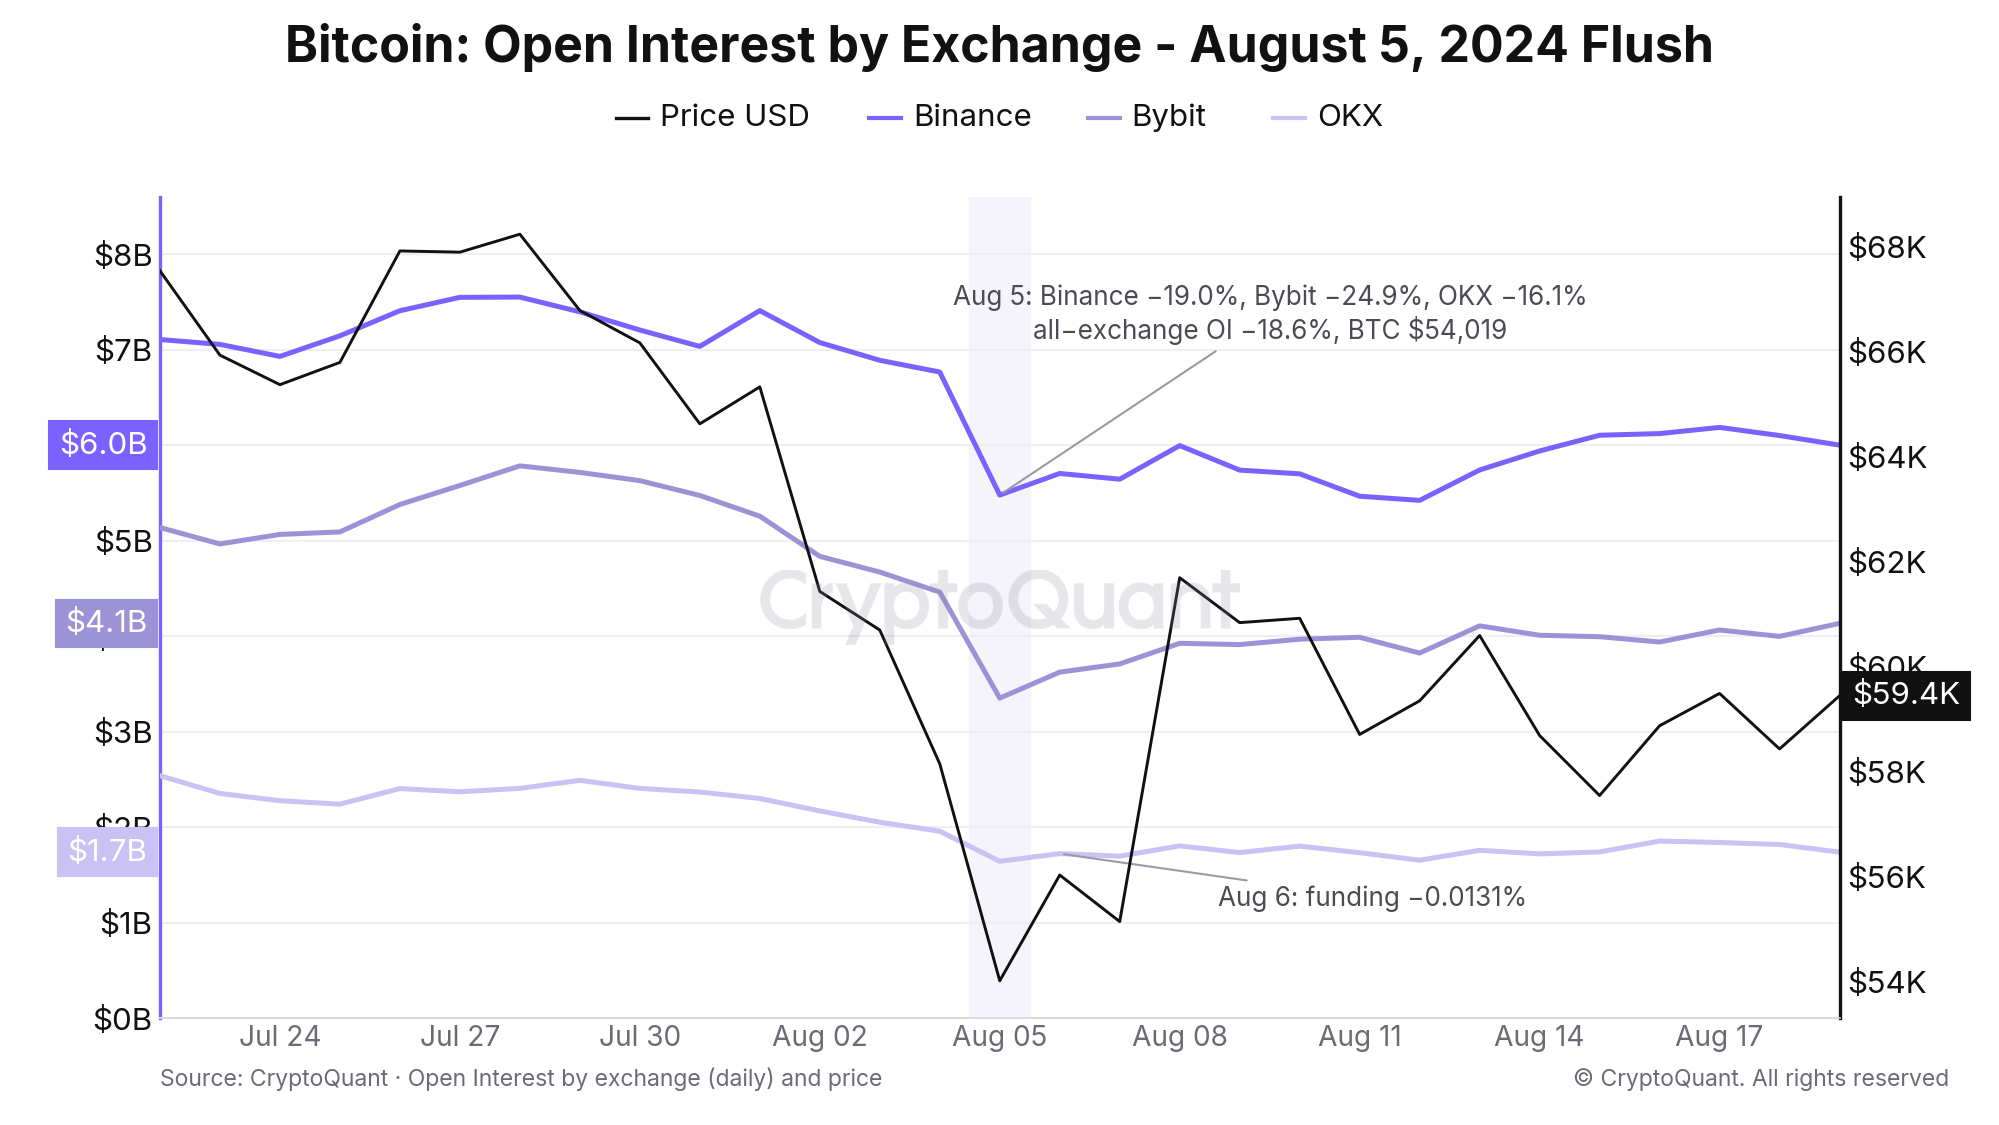
The August 5, 2024 leverage flush by exchange. Binance open interest fell 19.0%, Bybit 24.9%, OKX 16.1%. Source: CryptoQuant.
2. Look for the funding print to flip negative
A flush that pushes funding below zero means shorts are now paying. Days when funding fell more than two standard deviations below its trailing mean are rare, seven since 2020, and six of them were followed by a higher price 90 days later with a median gain of +21.0%. On May 19, 2021, open interest fell 34.0% and funding printed −0.0519%. Bitcoin was 6.9% higher a week later. On March 11, 2023, funding printed −0.0679% and Bitcoin gained 45.9% in the following 30 days. On August 6, 2024, the day after the flush above, funding printed −0.0131%.
3. Read a build-up as the opposite setup
Days when open interest jumps more than two standard deviations above its trailing mean are the mirror image. There are 53 of them since 2020. The median 30-day return after a build-up is −1.6% and only 42% closed higher. On September 21, 2026, open interest rose 9.2% in a day to $29.3 billion with Bitcoin at $86,601. Thirty days later the price was 3.0% lower. On October 21, 2026, open interest rose 6.1% to $27.1 billion, then gave back 4.3% the next day as Bitcoin fell 3.1%.
4. Expect flushes to cluster
The first flush is often not the last. On January 31, 2026, open interest fell 9.8% with Bitcoin at $78,719. The 30-day return from that close was −12.6%. The second flush came on February 5, 2026, at $62,809, and that one was followed by a +7.1% 30-day return. The 2021 sequence was similar. An 18.0% flush on April 18, 2021 preceded the 34.0% flush on May 19, 2021 by 31 days. Flushes after a seven-day price decline (28 events) closed higher a week later 64% of the time. Flushes after a seven-day price rise (17 events) did so 47% of the time.
When funding and open interest mislead
Crowded longs at a record price. April 18, 2021 looked like the ideal setup. The seven-day funding average was 0.0766%, the highest before any flush in the sample, and open interest had just come off a record $14.8 billion. Bitcoin closed at $56,237 that day and was 23.8% lower 30 days later. One flush did not clear a crowd that had been paying 0.1252% a day a week earlier.
Extreme funding as a top signal. Funding above two standard deviations has happened 15 times since 2020. The median 30-day return after those prints is +14.1%, with 80% of events higher. The two March 2021 prints, 0.0869% on March 11 and 0.0860% on March 30, were each followed by a 90-day loss of more than 35%. The December 5, 2024 print of 0.0664% was followed by a 90-day loss of 6.6%. The August 14, 2026 print of 0.0228% was followed by a +21.9% 30-day gain. High funding tells you the market is crowded. It does not tell you when the crowd gets hit.
A record flush with no crowd. October 10, 2025 was the largest flush in dollar terms on record. Open interest fell $11.4 billion in a day, from $45.6 billion to $34.2 billion, with Binance down 26.3% and Bybit down 28.8%. The seven-day funding average before it was 0.0086%, below the crowded threshold, and funding stayed positive on the day. Bitcoin was 7.3% lower after 30 days and 19.4% lower after 90. Dollar size alone did not make it a washout.
A five-step checklist
1.
Open the open interest chart on the daily window and note the day's percentage change. Below −6% counts as a flush at today's two-sigma threshold.
2.
Open funding rates and average the seven prints before the flush. Above 0.01% means longs were crowded.
3.
Check the funding print on the flush day and the day after. A negative print means shorts are now paying.
4.
Check exchange netflow for derivative exchanges and the per-exchange open interest split to see where leverage was cut. Our guide to exchange netflow explains how to read those flows.
5.
Write down the horizon before you look at the outcome. The baselines since 2020 are +0.4% after 7 days, +1.7% after 30 and +7.1% after 90.
What it is saying now
As of November 4, 2026, all-exchange open interest is $26.4 billion. That is up 2.9% over 30 days while Bitcoin fell 6.2% to $80,434. Funding is 0.0067%, with a seven-day average of 0.0079%, in the 78th percentile of the past year. The last leverage flush was June 17, 2026, when open interest fell 9.4% with Bitcoin at $64,454. Nothing since then has crossed the threshold, a gap of 140 days. The Binance hack on October 29, 2026 took Bitcoin down 4.2% to $77,931, but open interest fell only 0.45% and funding stayed positive. Derivative exchanges saw a net outflow of 21,259 BTC that day. Leverage is being added into a falling price with longs still paying. That is the build-up pattern from the table, not the flush pattern.
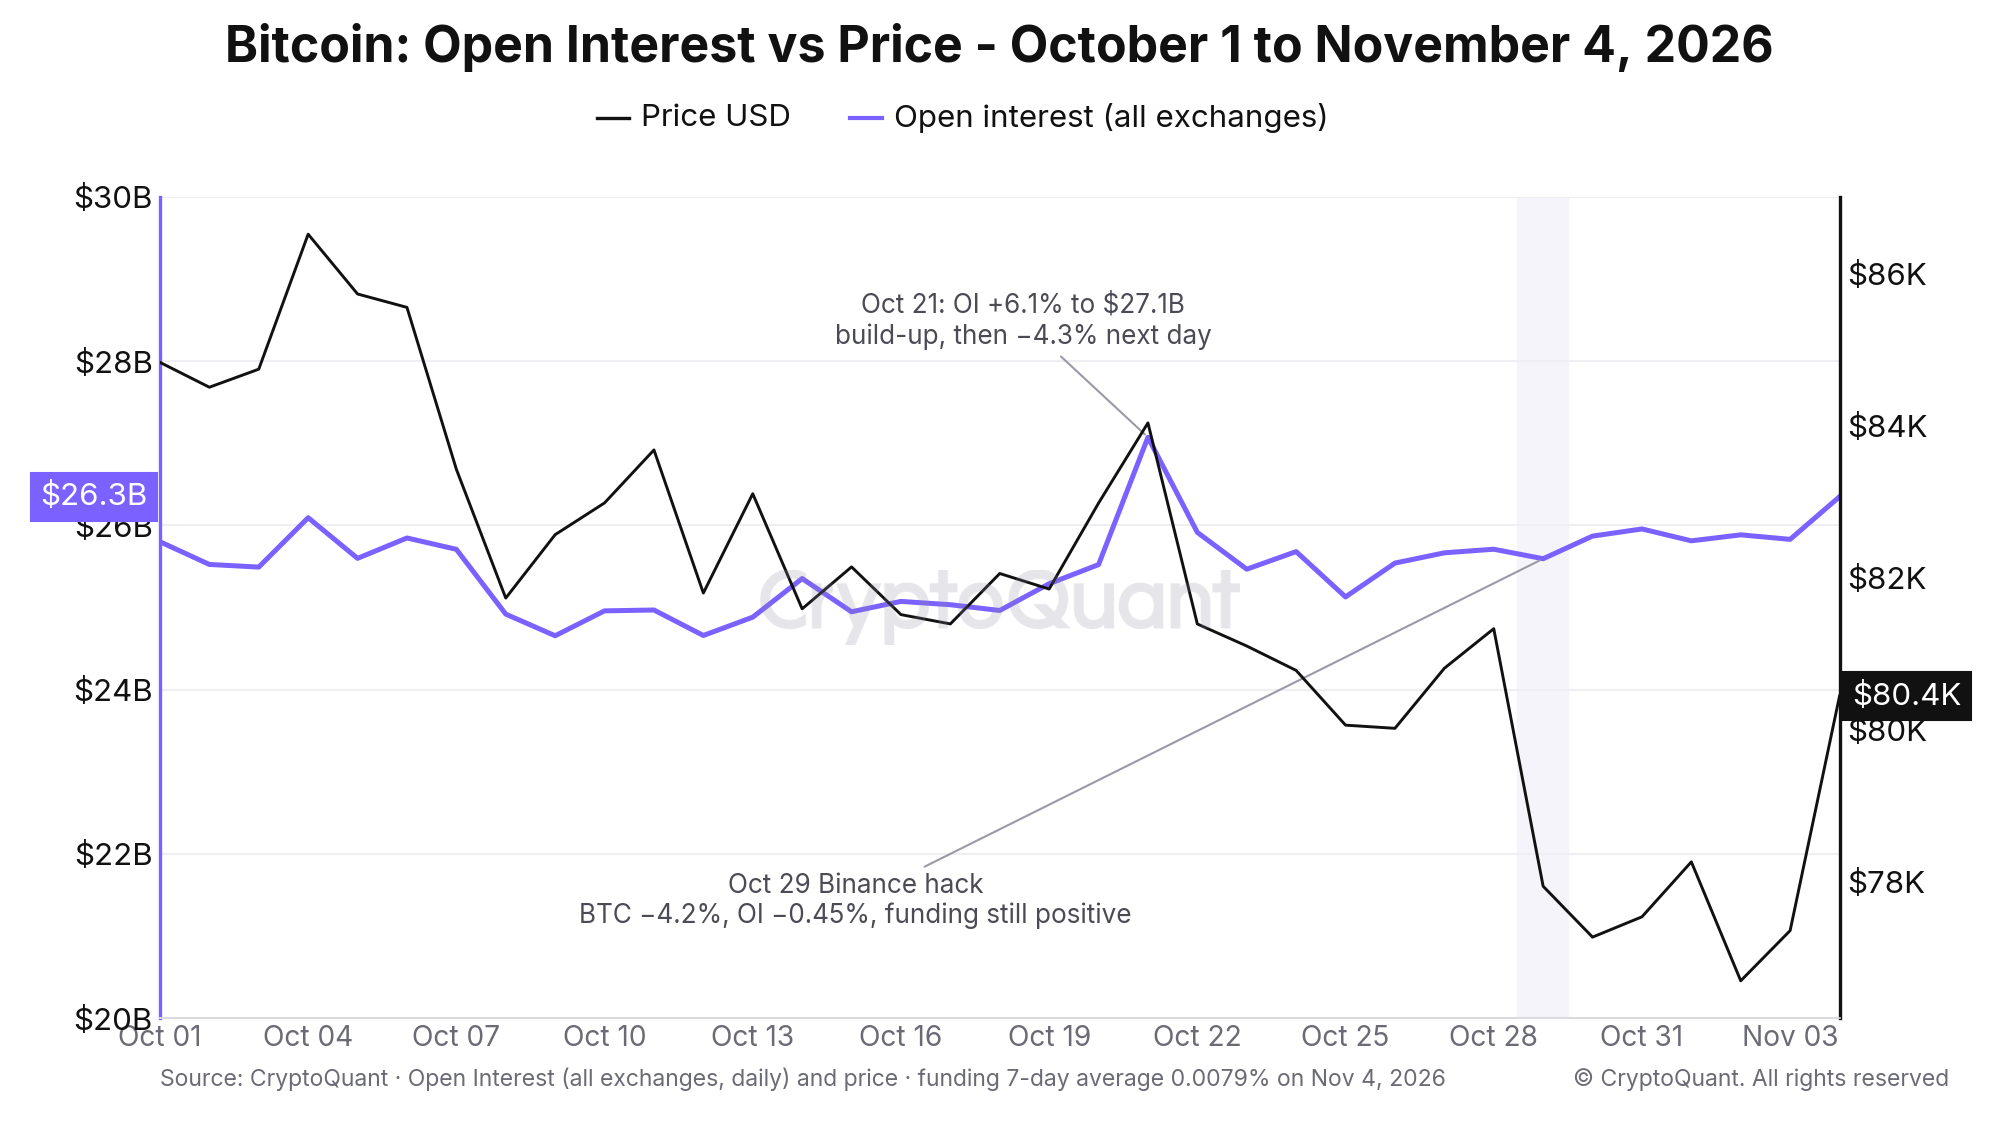
Open interest and funding since early October 2026. The October 29 hack day is marked. Source: CryptoQuant.
Track it live
API: /v1/btc/market-data/funding-rates and /v1/btc/market-data/open-interest through the CryptoQuant API
MCP: pull the same series into your agent with CryptoQuant MCP
FAQ
What is a Bitcoin funding rate?
A funding rate is the periodic payment between long and short holders of a perpetual futures contract. It keeps the contract price close to spot. A positive rate means longs pay shorts. The Bitcoin funding rates chart shows the daily average across major exchanges.
What counts as a high funding rate?
Since 2020 the median daily print is 0.0059%. Readings above 0.037% have happened on only 5% of days, and readings above 0.01% sustained for a week mark what this post calls crowded longs. High funding describes a crowded market, not a top.
What does a drop in open interest mean?
Open interest falls when positions close. A gradual decline usually means traders are taking profit or stepping back. A single-day drop of 15% or more almost always means liquidations. The open interest chart shows daily all-exchange and per-exchange values.
How often does a leverage flush happen?
Using a two-sigma threshold on daily open interest changes, there have been 45 flushes since January 2020, about six or seven a year. The most recent was June 17, 2026. The largest in dollar terms was October 10, 2025, when open interest fell $11.4 billion in a day.
Where can I get funding rate and open interest data?
Both series are available by exchange and in aggregate through the CryptoQuant API and the CryptoQuant MCP. The open interest user guide lists the exchanges covered.